Do the solar summary, the pooled correction network, and the gap rule stack on the best-guess demand forecast, or do they remove the same error?
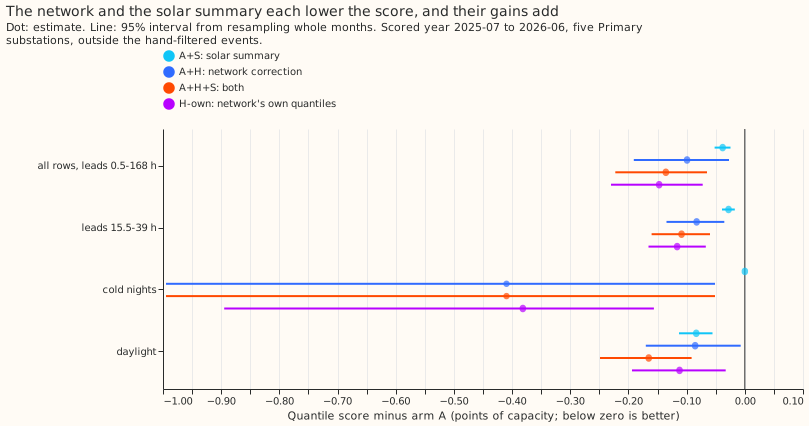
Take-home. A small neural network that corrects the demand forecast's median and a two-number summary of the ensemble's solar response lower the best-guess forecast's quantile score by 0.136 points of substation effective capacity (5%). That is the sum of what each part gains alone. The network and the solar summary remove different errors, so both belong in the next stack. The network's own uncertainty bands scored 0.048 points better than the hand-fitted bands plus the network's correction (A+H), and about 0.01 better than A+H+S, a difference inside the noise of C1 (on cold nights A+H+S scores 2.838 and H-own 2.866), so the band fixes of experiments 160 and 164 may not be needed once the network is in the stack. The coast-and-widen rule for missing readings was not combined with the stack (see "What was not done").
We asked whether three parts added to the best-guess forecast since experiment 170 stack, meaning that their gains add. We asked because experiment 167's drift gain of 0.50 points fell to -0.03 inside the full stack. The quantile score is twice the mean pinball loss over 11 quantiles, in points of a substation's effective capacity (lower is better). Coverage of a quantile is the share of readings at or under it. "Drop-one" means removing one part from the stack and scoring the rest. The labels are:
- A is the best-guess forecast: the convex demand model with a Kalman filter on recent errors, a winter night offset, and recipe R (a 14-day error profile subtracted from the forecast), from experiment 155 (its arm D), with the bands of experiment 169.
- S is the solar summary: the mean and spread of the 51 ensemble members' solar response, from experiment 193 and its rolling replay, experiment 202 (built on experiment 187). A+S is A with S.
- H is the correction network: the two-hidden-layer neural network of experiment 201 that shifts A's median, with experiment 200 and experiment 209 as its evidence. A+H is A with its median shifted by H; A+H+S has both. H-own is the network's own 11 quantiles, with none of the band fixes of experiments 160 and 164.
- C is the coast-and-widen rule for missing readings of experiment 205. It was not scored here.
We re-scored the stored forecasts of all three parts, refitted nothing, and scored the combinations on one shared set of rows: the five decision substations (D5, D10, D11, D14, D16), over the scored year 2025-07 to 2026-06, outside the hand-filtered events (stretches of telemetry that a hand-made list marks as unusable). D9 is a sixth substation that appears in the six-substation tables only. A cold night is a winter (November to March) evening or night whose ERA5 (the ECMWF reanalysis, an estimate of past weather) daily mean temperature is below 2 °C. Contrasts are written C1 (A+H+S minus A), C2 (the stacking ratio), C3 (H-own minus A+H), and C5 (each drop-one row minus A+H+S). A negative score difference is a gain.
Results
- Arms and row set. A 2.752; A+S 2.714; A+H 2.653; A+H+S 2.616; H-own (the network's own 11 quantiles) 2.605. Five decision substations, 464,363 rows, leads 0.5 to 168 hours, outside the hand-filtered events. Leads 15.5 to 39 hours (66,844 rows): A 2.430; A+S 2.402; A+H 2.347; A+H+S 2.321; H-own 2.314. Six substations with D9 (561,363 rows): A 2.688; A+H+S 2.578; H-own 2.568.
- Schedule. The weekly-refit mean forecast and bands are experiment 155's and 169's stored forecasts; the network was trained once on rows before 2025-07; the solar factors are refitted monthly (experiment 202). Nothing was refitted here. The network's correction and quantiles are the mean over experiment 201's three seeds. We scored one year only, because the network and the solar summary were built for that year alone.
- The network and the solar summary add (prediction 1 passed). C1 (A+H+S minus A) is -0.136 (95% -0.223 to -0.065; 99% -0.253 to -0.047). A+H alone is -0.099 (-0.191 to -0.027), A+S alone -0.038 (-0.052 to -0.025). The stacking ratio C1 / (A+H + A+S) is 0.99 (95% 0.95 to 1.05), the interaction +0.002 (-0.004 to +0.008). At leads 15.5 to 39 hours, C1 is -0.109 (-0.160 to -0.060) and the stacking ratio is 0.98.
- The network's own bands match the band fixes on cold nights but score better overall (prediction
2 failed on its score clause). H-own's cold-night q95 coverage is 0.904 (A 0.896),
so the coverage clause passed. H-own scores 0.048 below A+H (-0.081 to -0.021), a gap outside the
pre-registered 0.02. The clause was two-sided, so it failed because H-own was better than
predicted, which is a favourable failure. A post hoc check (run after seeing the scores;
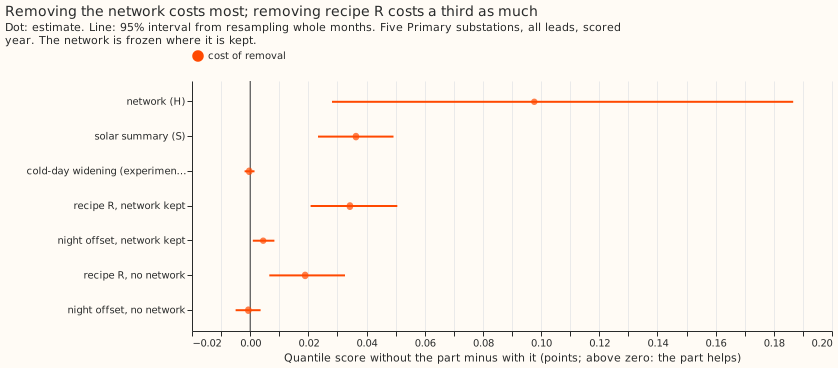
e00220_posthoc.py) shows that single-seed networks give gaps of -0.040, -0.042, and -0.043, so averaging the three seeds does not explain the gap. At D10 alone it is -0.138, -0.121, and -0.129 across the seeds, and without D10 it is -0.014 to -0.021; the network's bands fit D10 much better than arm A's bands. - The network matters most in the drop-one table (prediction 3 passed). The score rises when a part is removed, by +0.098 for the network (+0.028 to +0.187), +0.036 for the solar summary (+0.023 to +0.049), +0.034 for recipe R with the network kept (+0.021 to +0.051) and +0.019 without it (+0.007 to +0.033), +0.004 for the winter night offset with the network kept (+0.001 to +0.008) and -0.001 without it (-0.005 to +0.004), and -0.0003 for experiment 164's cold-day widening (-0.002 to +0.0015). We did not retrain the network without recipe R or the offset. The network was trained on arm D, which contains both, so removing R from the stack understates how much R helps.
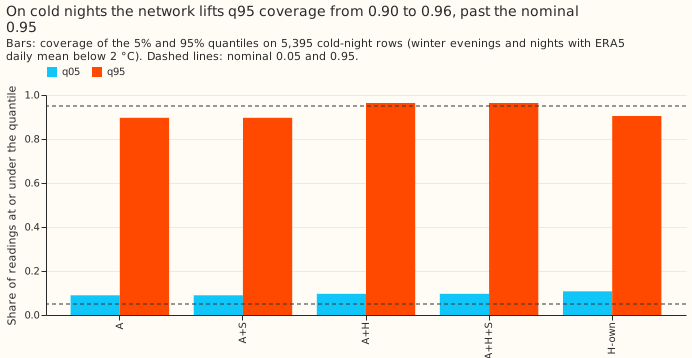
- Tail calibration, coverage / pinball loss (five substations). All rows: A q01 0.022 / 0.216, q05 0.065 / 0.714, q95 0.948 / 0.745, q99 0.982 / 0.232; A+H+S 0.012 / 0.177, 0.046 / 0.638, 0.954 / 0.703, 0.985 / 0.216; H-own 0.020 / 0.173, 0.069 / 0.621, 0.940 / 0.704, 0.980 / 0.224. Cold nights (5,395 rows): A 0.045 / 0.391, 0.090 / 0.950, 0.896 / 0.819, 0.959 / 0.282; A+H 0.054 / 0.407, 0.097 / 0.939, 0.964 / 0.622, 0.986 / 0.174; H-own 0.051 / 0.384, 0.108 / 0.908, 0.904 / 0.716, 0.955 / 0.271. Daylight (211,576 rows): A 0.027 / 0.265, 0.078 / 0.907, 0.933 / 0.924, 0.979 / 0.262; A+S 0.016 / 0.236, 0.058 / 0.838, 0.941 / 0.877, 0.983 / 0.245; A+H+S 0.013 / 0.218, 0.052 / 0.805, 0.944 / 0.850, 0.985 / 0.234.
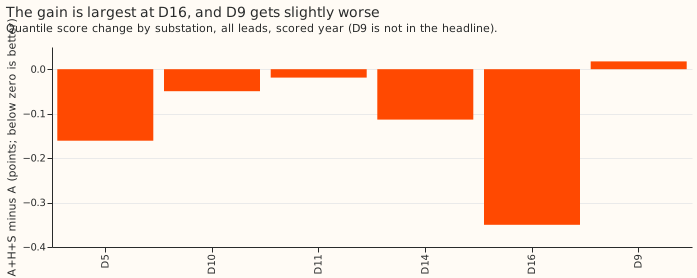
- Substations. A+H+S minus A: D16 -0.350, D5 -0.161, D14 -0.113, D10 -0.049, D11 -0.019, D9 +0.018. Leaving out one decision substation keeps C1 between -0.083 (D16 out) and -0.167.
- Gates (all passed). Arm A 2.7521 (target 2.7519, within 0.005); arm A equals experiment 202's
stored A on every shared row and experiment 201's
actualmatches (difference 0); R2's daylight change -2.30% (target -2.30%); arm D scores 2.756 at five substations (printed 2.756), and the three seeds of experiment 201's second arm score -0.109, -0.110, and -0.093 below arm D at six substations (the mean of the three is -0.104, matching the printed -0.104; the seed-averaged quantiles used elsewhere here give -0.123); building A+H+S directly and as A plus the R2 change plusdeltaagrees to 7.6e-6, the float32 storage precision (this checks arithmetic and storage only, since both sides use the same stored arrays).
Checks
- Median minus mean forecast, 12 to 36 hours, per site. A and A+S: 0.000 and -0.03 to -0.14 (the solar summary). A+H: D10 +0.67, D11 -0.32, D14 -0.17, D16 -0.59, D5 +0.18, D9 -0.47, which is the network's correction by construction.
- Error of the median beside each quantile-score contrast. The mean absolute error of the median moves the same way as the score: C1 -0.146, A+H -0.145, A+S 0.000, removing R with the network +0.079, removing the network +0.146. H-own minus A+H is 0.000 on this error but -0.048 on the score, so the gap is in the bands.
- Audit conditions (the seven in the
ml-experimentskill). None was met. Condition 2 (H-own beat A+H by more than predicted) was tested with the single-seed and leave-D10-out runs above (e00220_posthoc.py), which locate the gap at D10. The nested-arm condition was not met: removing the widening changes the score by -0.0003, inside its interval.
What was not done
- The coast-and-widen rule (arm A+H+S+C) was not scored. Experiment 205's code imports a GPU-only library through a chain of six modules, and the environment here has no GPU group installed. Composing a gap's effect onto the network and the solar summary would also be a post hoc approximation. Experiment 205's own gain, 0.25 to 0.44 points on gap rows, stands as measured against a forecast without the correction.
- No replicate year. The network and the solar summary were built for the scored year only.
- No curtailment-cost figure. The node-level curtailment metric was not run on the new arms.
- Network not retrained in the drop-one rows. The two score losses from removing recipe R or the offset are lower bounds.
Caveats and what to try next
- One year and five substations. D16 carries 0.35 of the gain at its own site, and D9 gets worse. Cold-night intervals rest on 3 months and are not quoted.
- Cold nights use realised weather. The mask is the ERA5 mean temperature of the UTC calendar day, which is not known at forecast time, so the cold-night coverage is not what a forecaster would see when it must predict that a night is cold. No arm is fitted on the mask.
- A+H overshoots on cold nights. Coverage at q95 is 0.964 against 0.95, and at q05 0.097 against 0.05, because the correction lifts A's bands that experiment 164 had already widened.
- Next. Test the network's own bands inside the stack with the solar summary applied to them, then add the gap rule once experiment 205's code runs without the GPU group. Prediction that could fail: H-own plus the solar summary scores at least 0.02 points below A+H+S over all rows.