Differentiable physics: is a neural network needed to recalibrate arm D, or does a table do the same?
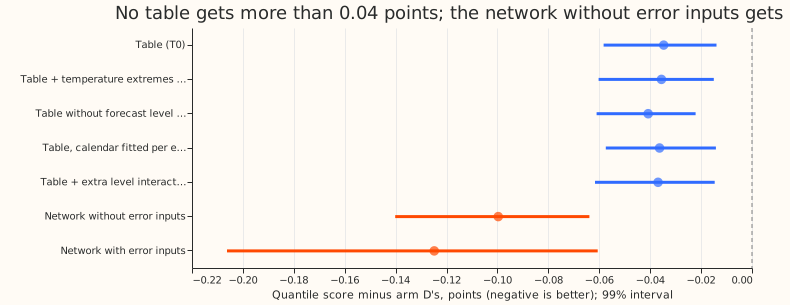
Take-home: lookup tables of corrections to arm D lower its score by only 0.03 to 0.04 points, while a neural network given similar inputs and no recent errors lowers it by 0.10, so this table design does not match the network and the cause is not yet isolated. Arm D is our best day-ahead demand forecast, from experiment 155. In experiment 200 a neural network learned corrections to arm D's median and uncertainty bands, and a copy of it that was given no recent forecast errors (the "network without error inputs") still gained 0.10 points. A lookup table had come within 0.01 to 0.02 points of that copy when both trained on one year of data. We asked whether a table still matches the network when both train on every year from 2020 on, and whether a term for temperature extremes (found in experiment 201) helps the table.
Answer: no table matches the network, and the temperature term helps by under 0.001 points. All
scores are quantile scores in points of effective capacity, where a lower score is better. On the
five decision substations in 2025-07-02 to 2026-06-29, the plain table (T0) scores 0.065 points worse
than the network without error inputs (T0 minus network; 99% interval over resampled months 0.042 to
0.086). Four table variants (T1 to T4) stay within 0.006 points of T0. The verdict is not supported,
because the rule fixed before the run needed the table to come within 0.02 points of the network.
Results
- Setup. Arm D is the best forecast of experiment 155. Each table is a sum of lookup terms, with no hidden layer, fitted by gradient descent on the pinball loss (Koenker and Bassett (1978)) over 11 quantiles. The terms shift arm D's median and scale its quantile offsets. Rows, training window (2020 to 2025-06-27), validation block, and scored rows (2025-07-02 to 2026-06-29, 15.5 to 39 hours ahead, outside switching events) are those of experiment 200. The network scores are experiment 200's stored rows. The table fits ran on CPU, with the median shifts and log-scales averaged over three seeds. The network rows are experiment 200's stored rows.
- Arms. T0: median shift by site and half-hour, site and weekday, site and lead band, half-hour and weekday, site by arm D's forecast level (12 bins) by weather era, and the ensemble-era flag. T1: T0 plus a temperature-extremes term. T2: T0 without the forecast level by era term. T3 and T4 are post hoc: T3 fits the calendar terms separately for each weather era, and T4 adds forecast level by six-hour block by era and forecast level by weekday by lead band.
- Scores (five decision substations, quantile score in points; lower is better). Arm D 2.432, T0 2.397, T1 2.396, T2 2.391, T3 2.395, T4 2.395, network without error inputs 2.332, network with error inputs 2.307.
- Contrasts against arm D (99% month-resampled intervals). T0 -0.035 (-0.058 to -0.014), T1 -0.036 (-0.060 to -0.015), T2 -0.041 (-0.061 to -0.022), T3 -0.036 (-0.057 to -0.014), T4 -0.037 (-0.062 to -0.015), network without error inputs -0.100 (-0.140 to -0.064), network with error inputs -0.125 (-0.207 to -0.060).
- Decision contrasts. T0 minus network without error inputs +0.065 (+0.042 to +0.086). T0 minus network with error inputs +0.090 (+0.038 to +0.171). T1 minus T0 -0.0009 (-0.0022 to -0.0001). T2 minus T0 -0.006 (-0.014 to +0.001), so the forecast level by era term does not help the table. T3 minus T0 -0.002 (-0.013 to +0.009). T4 minus T0 -0.002 (-0.009 to +0.004).
- Tails (T0, decision substations). Coverage at q95 94.8%, at q99 98.3%, at q05 6.3%, at q01 2.0%. Pinball at q99 0.385 and at q01 0.352, against arm D's 0.411 and 0.386.
- Per substation, T0 minus arm D. D5 -0.056, D10 +0.026, D11 +0.014, D14 -0.099, D16 -0.063, D9 +0.018. Leaving one decision substation out keeps T0 minus the network without error inputs between +0.039 and +0.077.
- Pre-registered predictions. The table within 0.02 points of the network failed (+0.065). The temperature term lowering the score by 0.01 to 0.04 points failed (0.0009). The decision rule's gain condition for the temperature term (an interval wholly below zero) is met, but at 0.0009 points the term is not worth porting. The prediction that an additive table without the era term scores worse than arm D was not tested as written: T2 drops only the forecast level by era term and keeps the era flag, and it beats arm D by 0.041.
- Caveats. The network has continuous inputs (lead, the sine and cosine of the half-hour, arm D's forecast) where the table has bins, and a spread head. The experiment does not say which of these the network needs. The table's spread scale is a lookup by site, lead band, and six-hour block. The temperature term is a linear hinge per substation. The driver temperature is the ensemble mean in the ensemble era and past weather before it.
Checks
- Median minus mean forecast per site and the error of the median forecast were not computed: the stored rows hold quantile scores only, and every table shifts the median directly. The contrasts rest on the quantile score alone.
- Triggers fired: trigger 2, because the result contradicts the pre-registered prediction and the reading of experiment 200's audit. The post hoc arms T3 and T4 tested two explanations and did not close the gap. The ML manager instructed that no audit run for this experiment.
- Row alignment: the rows match experiment 200's stored rows (arm D losses agree within 0.001).
What to try next
- Ablate the network without error inputs one input at a time (lead, half-hour, forecast level, era) to find the input whose smooth use the table misses.
- Fit a gradient-boosted model with the pinball loss on the same inputs, as a second route to the same gain with an interpretable form.