Production reference and best guess
On one validation year, the best recipe tested so far beats the stored production-style forecast at Primary substations, supply points, 6 solar farms, and 3 wind farms. Most of the gain at Primary substations comes from correcting each forecast by its mean error over the previous 14 days, and refitting weekly adds a little more. The experiments scored one validation year (July 2025 to June 2026), and several settings were chosen on that year, so the gains are probably optimistic. Nothing from this theme is adopted in production, and the best training source for solar and wind farms is unsettled.
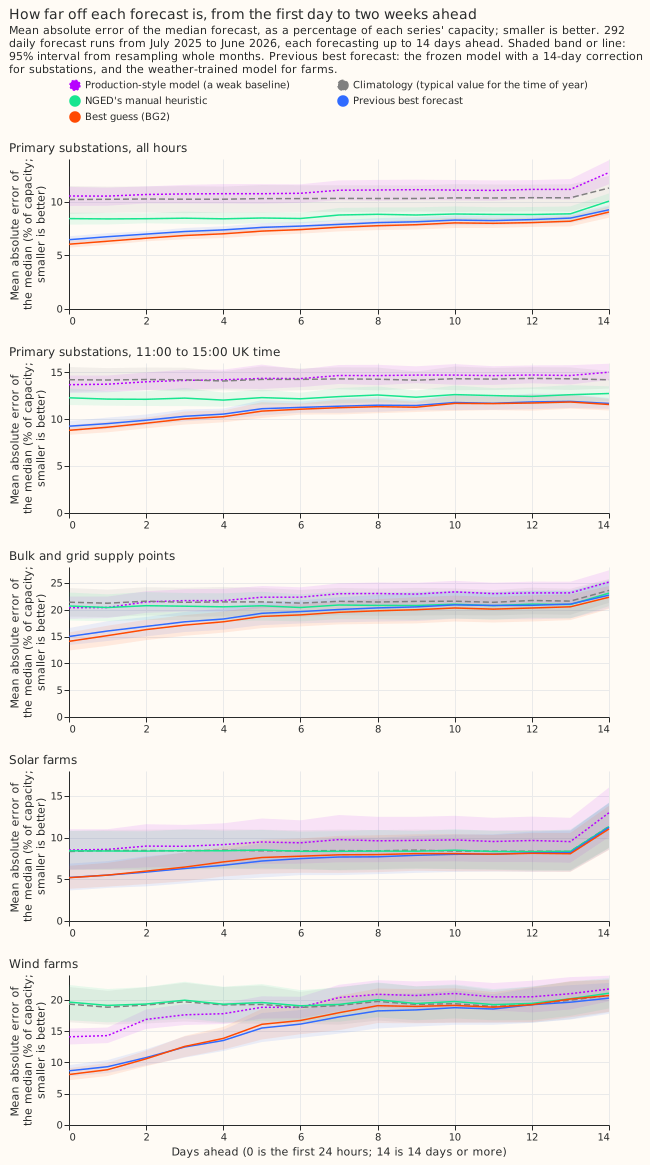
Over all lead times, BG2 has a lower mean absolute error of the median
than manual_heuristic for all four target classes, for
example 7.43 against 8.70 at Primary substations (experiment
87).
Does it work?
The stored production-style forecast loses to a simple rule. In experiment
13, the
xgboost_baseline forecast had an error of the median 1.69
points of capacity above manual_heuristic's (99% interval +0.98 to +2.59; 16 Primaries).
N1 was level with manual_heuristic (+0.22, -0.54 to +0.97), so that
verdict was inconclusive.
The 14-day correction supplies nearly all of the early
gain. In experiment 19, the
correction lowered N1's quantile score by 0.99
points, and the stack of experiment 19 (N1 with the correction, a
half-life, and a spread factor)
beat manual_heuristic by 0.56 (99.44% interval -0.93 to -0.26). The half-life added nothing to a
frozen model. In experiment 87, the correction on a frozen XGBoost
model lowers the Primary score by 1.38 of the 1.67 points
that BG2 gains, and weekly refitting lowers it by a further 0.12 (95% interval 0.05 to 0.20).
The best guess of experiment 33 beats the production-style forecast by 3.8 to 6.3 points. The experiment 33 contrasts are 4.89 for Primary demand (98.33% interval -5.66 to -4.06), 3.81 for solar farms (-5.07 to -2.64), and 6.27 for wind farms (-7.65 to -5.28), all at the 98.33% level. The farm contrasts use 53 Tuesday runs and the Primary contrast 73 runs. The correction applied to production explains 1.38 of the 4.89 Primary points. No arm widened production's band, so the share due to calibration is untested. The production-style 0.95 quantile was exceeded in 49% of Primary cases, against 7% for the best guess.
BG2 beats the previous best forecast at Primaries and supply points. BG2 lowered the score by 0.283 at the 16 Primaries (98.75% interval -0.425 to -0.146) and by 0.634 at the 4 supply points (-1.111 to -0.279). Adding the five-model blend lowered the Primary score by 0.086 (0.038 to 0.135). The solar offset lowered it by 0.114 (0.075 to 0.164) on the rows it can touch, which are the daylight rows from April to September at the 5 of 16 Primaries that carry an offset. Over all scored rows the gain dilutes to 0.010.
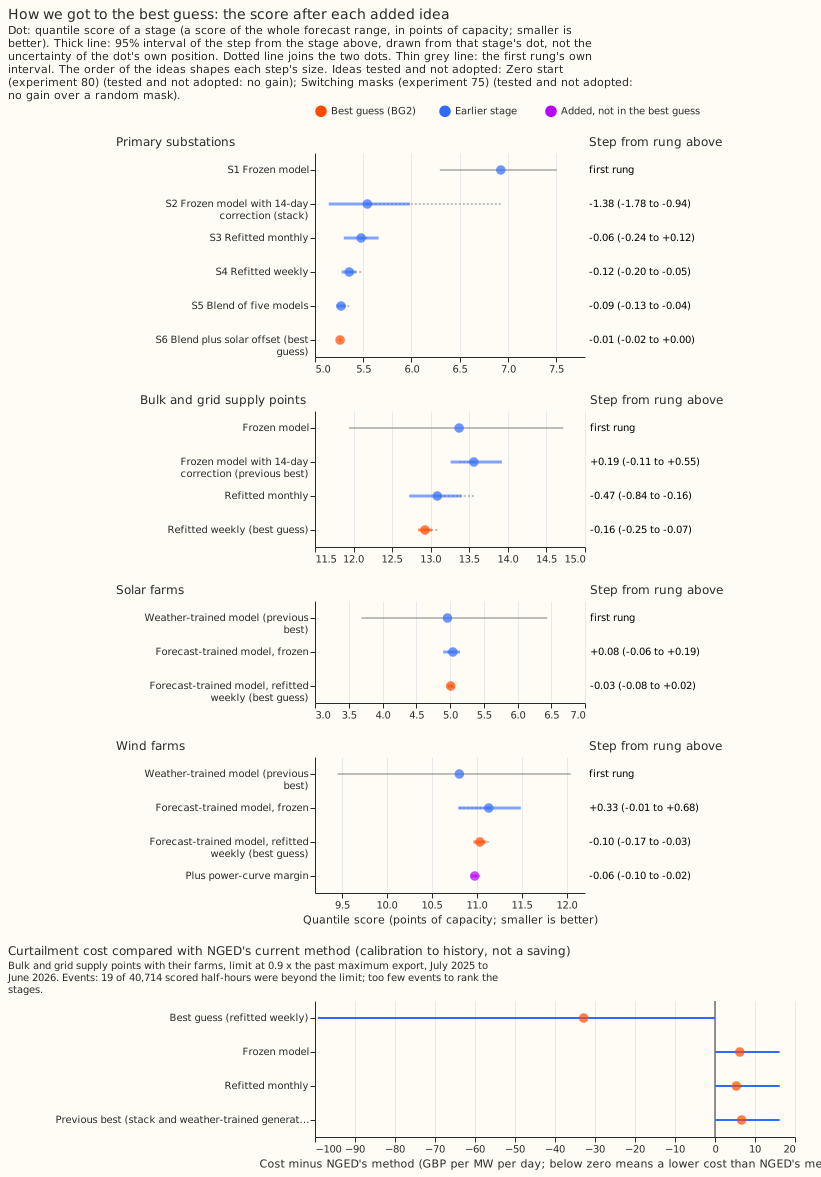
The correction is the largest step, and weekly refitting, the blend, and the solar offset add small steps (experiment 87).
The solar and wind farm models cannot yet be ranked. The ensemble-trained model scored 0.050 points worse than the ERA5-trained mixture at 6 solar farms (98.75% interval -0.125 to +0.168) and 0.228 worse at 3 wind farms (-0.178 to +0.653). Neither interval rules out a loss above the margin we would accept (0.10 and 0.30), which is why the verdict of experiment 87 is partly supported.
Better weather would add little for Primary demand. In experiment 22, ERA5 weather in place of ENS weather lowered the score by 0.10 points (99.38% interval -0.16 to -0.04), and not at all within 2 days. A demand model retrained on ERA5 lowered the score by 0.27 against an ENS-trained N1 with the correction (experiment 33). Both are ceilings, because ERA5 arrives about 5 days late.
Whether the metering unit causes the MVA-only skill gap is unsettled. In experiment 56, skill was 10.5 percentage points lower at the 8 MVA series than at the 8 MW series over all hours (95% interval 2.1 to 17.5, resampling months), and the gap was smaller at sunny middays (April to September, 10:00 to 13:30 UTC: 5.6, -5.0 to 14.6). Resampling series instead of months gives -2.0 to 20.2 over all hours, so the data cannot separate the metering from which series were chosen. The experiment found no evidence of a need for special handling and cannot rule out a loss of about 15 points at sunny middays.
Best design so far
BG2 is the best of the recipes tested here for Primaries and supply points, and no recipe is ranked for farms.
- Primaries: a five-member quantile blend with a solar offset at 5 of 16 Primaries, scoring 5.260 against 5.543 for the frozen stack (experiment 87).
- Supply points: the weekly-refitted XGBoost model with no correction, scoring 12.925 against 13.559 for the frozen stack (experiment 87).
- Solar and wind farms: the ERA5-trained mixture of experiment 33 and the ensemble-trained model of experiment 87 are within each other's intervals.
Candidates for production
Experiments 19, 33, and 87 are marked candidate; none is adopted.
- Primary demand: add the 14-day correction and the spread factor of 1.15 to N1 (experiment 19, experiment 33). Applied to the production forecast, the correction raised the threshold-weighted CRPS above the 99th percentile of history from 0.067 to 0.107 (higher is worse), and on N1 from 0.058 to 0.064, so check the tail when porting it.
- Primaries and supply points: refit weekly, and blend five models at Primaries (experiment 87). Serve supply points without the correction.
- Solar and wind farms: either the ERA5-trained mixture or the ensemble-trained model beats the production-style forecast, and which to serve is unresolved. Adding the power-curve base margin lowered the wind score by 0.057 (95% interval 0.024 to 0.098), and the solar bands need recalibration (experiment 87).
Experiments 13, 22, and 56 are not-for-production.
Gotchas and implementation details
- Score every arm on the same cases. Without it, arms with missing forecasts are compared on
different rows. The stored production forecast lacked 124 of 282,916 solar and wind cases and
manual_heuristiclacked 195 (experiment 33). Look for arms with different run sets or ensemble members. - Compare with
manual_heuristicas well as production. The quantile score at the 16 Primaries over 73 runs was 9.52 for production and 5.89 formanual_heuristic, so a gain over production alone overstates a new XGBoost model (experiment 13, experiment 33). Look for a changed production recipe. - Do not add the correction to supply points without a new test. It raised the supply-point score by 0.305 (0.060 to 0.594) in experiment 87, and experiment 33 found no gain there (+0.38, -0.12 to +0.92). The farms were not tested. Look for a second validation year or more than 4 supply points.
- Build the correction history from daily forecasts. Experiment 19 used runs 5 days apart, so past errors were probably larger than a daily service would see, whereas experiment 87 scored 292 daily runs and its assembly script builds each correction from earlier runs. Look for a forecast service that runs less often than daily, which would make the history sparser.
- Treat settings tuned on the scored year as optimistic. The spread factor, the blend scheme, the choice of which Primaries get the solar offset, and the half-life were chosen on the validation year (experiment 87). Look for results on a later year.
- Read a staircase and a drop-one ablation separately. Adding the blend lowers the staircase score by 0.086, whereas removing it from BG2 raises the score by 0.091, because each starts from a different forecast (experiment 87). Look for a new member of the blend.
- Report tail coverage and pinball loss as well as the quantile score. The quantile score hid that BG2's solar bands are too wide (experiment 87) and that production covers only 10% to 20% of cases (experiment 33). Look for a new weather source or target class.
- Do not rely on the production-style row until its origin is confirmed. It was read from a stored table of unconfirmed origin, so its 10.54 may not match the deployed forecast (experiment 87). Look for a comparison with the current production forecasts.
What we have not settled
- Whether the correction and the weekly refit hold their gains on a second validation year.
- Which training source suits solar and wind farms, which needs more than 6 solar and 3 wind farms.
- Whether the solar offset helps on daylight rows from April to September.
- Whether the 10.5-point all-hours skill gap of MVA-only Primaries (2.1 to 17.5 over months, -2.0 to 20.2 over series) is caused by the metering, which needs more than 8 MVA series.
- Whether monthly retraining without the correction beats the best guess of experiment 33: it scored 5.12 on one seed against 5.32, and needs a test on three seeds and more than one validation year.
The Research plan lists what is planned next.