Demand inputs
At Primary substations, a calendar-and-solar set of inputs lowered the demand forecast error by 0.1 points of capacity or more with an interval clear of zero: the hour and weekday, the COVID indicator, a Christmas column limited to the 14 days either side of 25 December, and an explicit forecast of the unmetered solar output. A heating term gave 0.14 points in cold hours up to 48 hours ahead on one winter, which is under its 0.3 target. The electricity price, school terms, statistics of installed solar capacity, substation fingerprints, and the PV_Live estimate of solar generation gave no gain of 0.1 points that held up.
The experiments added one kind of information at a time to an XGBoost demand forecast and scored the change against the same XGBoost model without it. They scored 13 to 16 Primary substations (experiment 74: 5), over one or two validation years, and experiments 27 and 28 scored two grid supply points. Errors are in points of capacity, a negative change is an improvement, and each number names its metric: the error of the median (the mean absolute error of the middle forecast) or the quantile score. Several gains in the selection year (the year used to choose inputs) vanished in the confirmation year (the later year used to check them) or against a control.
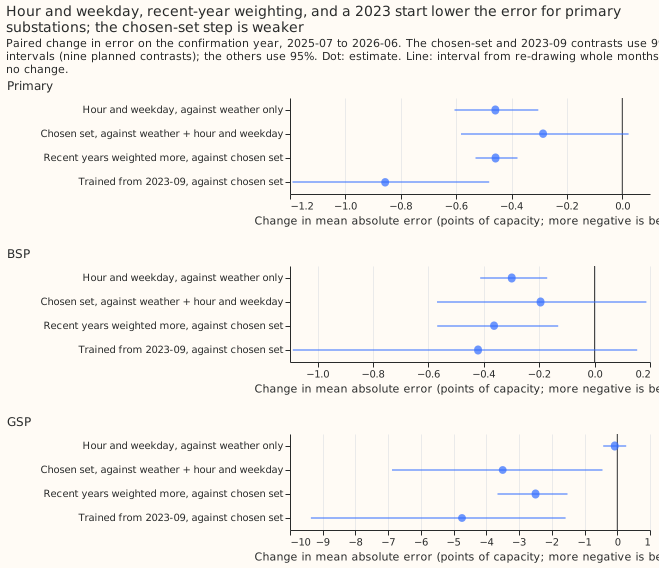
For Primary substations on the confirmation year (July 2025 to June 2026), adding the hour and weekday to the weather lowered the error of the median by 0.46 points (99.4% interval -0.61 to -0.30), the largest single input. The panels show the same contrasts for the 2 bulk and 2 grid supply points, which have too few series to settle. Source: experiment 6, an ERA5-trained stage 1a XGBoost model on 14 Primaries.
Does it work?
The hour and weekday, the COVID indicator, and a windowed Christmas column help; school terms do
not. In experiment 6 the hour and weekday lowered the error of the median by 0.55 points on the
selection year, a third of the 1.5 predicted, and the pre-registered COVID indicator by 0.26 (-0.40
to -0.10). The Christmas column is weaker evidence. The 15 December to 7 January window was chosen
after the run, and the column lowered the Primary error there by 1.78 points (95% interval -2.30 to
-1.26) and changed it by 0.00 elsewhere. The gain is concentrated: the median-error series barely
moved (3.96 to 3.95 in the confirmation year) and a series picked after the fact fell from 22.23 to
4.13. Dropping the column from the chosen set changed the selection-year Primary error by +0.14
(-0.06 to +0.35), and the whole-year effect was -0.10. Experiment
11 found no gain from
return-to-work or school-term columns on Lincolnshire Primaries: +0.20 at Easter (99.2% interval
-0.19 to +0.59) and -0.29 in half-terms (-0.68 to +0.07). The experiment's own rule gives refuted,
and its write-up reads Easter and half-terms as inconclusive.
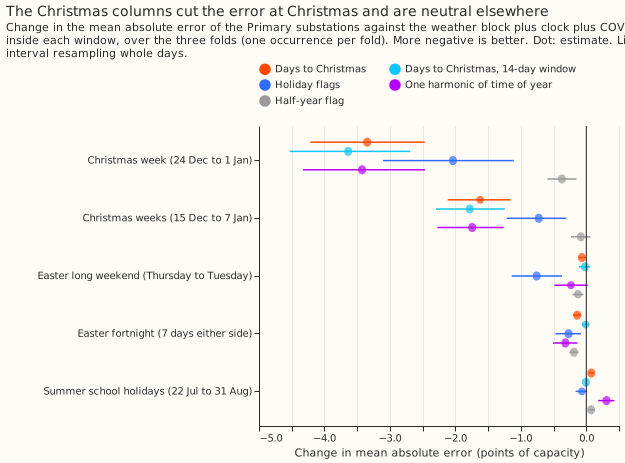
The Christmas columns cut the Christmas error and leave other days unchanged. Source: experiment 6, post hoc windows (chosen after seeing the results), three folds.
An explicit forecast of the unmetered solar output lowers the daylight error; same-time analogues may too, and the data could not rank the two. In experiment 74, five Primaries refitted monthly and scored on daylight April-to-September rows, the explicit offset lowered the quantile score by 0.149 (99.17% interval -0.201 to -0.104) and 3 analogues by 0.095 (-0.185 to -0.007), against a monthly refit with neither. An offset built from another date's sunshine scored 0.246 worse than the real offset. Statistics of installed capacity did not help 16 Primaries (+0.006, -0.022 to +0.033; experiment 31).
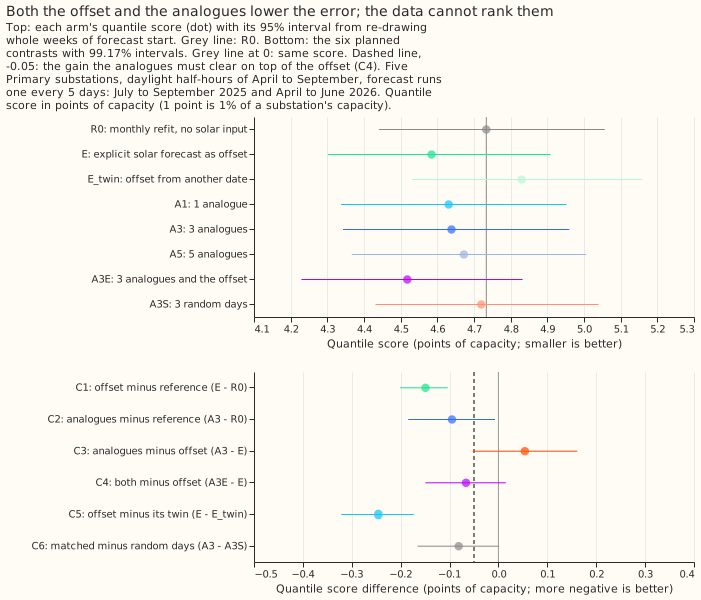
Both ways of telling the XGBoost model about sunshine lowered the daylight error, and the intervals overlap. Source: experiment 74, 5 Primaries, one validation year.
Satellite sunshine as a training input gave no resolved gain, and a correction of the forecast
sunshine a further small one. Training on CAMS irradiance
changed the Primary quantile score by -0.035 (97.5% interval -0.070 to +0.001), refuted against
0.2 planned (experiment 9).
Mapping the ENS shortwave onto CAMS lowered it by a further 0.067 (-0.094 to -0.039), which makes the
pair 0.102 better than the ERA5-trained arm, but the monthly ratio to CAMS still ran from 0.81 to
1.13, so the verdict is inconclusive (experiment
14). PV_Live,
Sheffield Solar's estimate of solar generation, gave no resolved gain at the two grid supply points
Walpole and Bicker Fen (experiment 27,
-0.03; experiment 28, -0.14 with
interval -0.34 to +0.04).
The electricity price gave no gain that held against a control. The price at the target half-hour lowered the pooled error of the median by 0.52 in the selection year (97.5% interval -0.88 to -0.11) and 0.18 in the confirmation year (-0.50 to +0.08), and a price from another week matched about 0.45 of the 0.52 (experiment 15). Price changes (experiment 25) and lagged prices (experiment 10) did no better.
Substation fingerprints and a heating term gave little. Fingerprints changed the quantile score by +0.02 (-0.05 to +0.10; experiment 32). A heating term lowered it by 0.143 in cold hours up to 48 hours ahead (98.75% interval -0.203 to -0.034) and by 0.022 over all rows (-0.042 to +0.000), on 16 Primaries over one winter in which three ISO weeks hold 66% of the cold rows. The q95 forecast was still exceeded in 16.2% of those hours (experiment 94). Experiments 24 and 30 are in the candidates below.
Best design so far
Among the experiments of this theme, no single one assembled the parts; the parts that beat their
controls are below. Experiment 87 (the production-reference theme) assembled several of them in
BG2. Give the weather-to-power XGBoost model the hour and weekday and the
days to Christmas inside a 14-day window (experiment
6). Where a clean solar capacity estimate
exists, add the forecast unmetered solar output as a base margin
(experiment 74,
using the offset of experiment
64; experiment 74 is
not-for-production). In BG2 the offset lowered the score by 0.114 on its daylight April-to-September
rows at the 5 Primaries that carry one, and by 0.010 over the whole year at all 16 Primaries
(experiment 87). The
stage 0 mapping (experiment
14) and the heating
term (experiment 94) are
candidates, not yet part of the design.
Candidates for production
Five experiments here are marked candidate, and each rests on one validation year or an
unconfirmed input.
- Stage 1a inputs (experiment 6): the clock, the COVID indicator (-0.26), recency weights (-0.32, half-life 2 years), and the windowed Christmas column for the ERA5-trained stage 1a XGBoost model. A training start of 2023-09 stays unconfirmed (0.86 better on the confirmation year, 0.05 on the selection year).
- Stage 0 (experiment 14): a quantile mapping of ENS shortwave onto CAMS for a CAMS-trained stage 1a, 0.067 points better.
- Pooling (experiment 24): one XGBoost model per substation type or size band (3 or 4 models instead of 20), 0.15 points worse (99.44% interval +0.03 to +0.26), with the series identifier.
- Weekly mean and median (experiment 30): two extra columns in N1 with the 14-day correction, 0.05 points better than N1 with it (-0.08 to -0.02). The arm is post hoc, and against the experiment 19 stack the 0.03 gain touches zero (-0.06 to +0.00).
- Heating term (experiment 94): a per-series base margin. The experiment advises a second winter before porting.
Gotchas and implementation details
- Add a placebo twin of every added input, a copy with the same level but the wrong timing. A price from another week matched 0.45 of the 0.52-point price gain (experiment 15), the shuffled price matched most of the gain at the battery site (experiment 10), an offset from another date scored 0.246 worse (experiment 74), and a shuffled capacity control matched the register products (experiment 31). Without the twin, a column that only carries a level is credited. Re-check with a different data source.
- Check a calendar column against a half-year flag and score it inside the special days. The unwindowed days-to-Christmas column flips sign every late June, so it acts as a half-year flag, and a time-of-year harmonic matched the Christmas gain but worsened summer (experiment 6). A column can also help a few days a year and barely move the yearly mean. Add a placebo calendar shifted by a fixed number of days (experiment 11). Re-check with more years than 3.
- Fix
colsample_bytreeat 1.0 in every arm of a column ablation. Experiments 6, 30, 31, and 32 did so because column subsampling hands the wider arm a free win. None measured the size of that effect. Re-check if the arms are ever given equal column counts. - Give every arm the same starting level. A start at zero lowered the error by 0.071 (-0.099 to -0.047) against XGBoost's estimated base score in experiment 78, and experiment 74 quotes 0.07 to 0.10 points, so it started every arm at the median of the training labels (experiment 74). Experiment 76 did not test the effect. Re-check with a different pipeline.
- Judge a lag set against N1 with the 14-day correction. The weekly lags gained 0.30 without the correction and lost 0.09 with it (experiment 30). Re-check if the correction changes.
- Read a selection-year gain only after a confirmation year. The price gain at the battery site fell from -0.92 to -0.06 (experiment 10), and a 2023-09 training start gained 0.05 and then 0.86 (experiment 6). Re-check with a third year.
- Test an input on the weather it will be served with. A CAMS-trained XGBoost model lowered the daylight error by 0.88 reading CAMS and by 0.04 reading ENS (experiment 9), and an ERA5-trained solar forecast ran 1.8 to 3.0 points too high on ENS members (experiment 28). Re-check with a different weather product.
- Report a pooled share with and without the largest-residual substation. One substation set the pooled share in experiment 7. Re-check on new series.
- Give every pooled XGBoost model the series identifier, and no fixed-window statistics for a held-out series. Dropping the identifier raised the score by 0.82 for by-type pools (experiment 24), and training-window statistics worsened a held-out substation by 1.39, probably because 7 series learn them as identifiers (experiment 32). Re-check with a pool of hundreds of series.
- Score cold-hour and special-day contrasts on more than one winter. Three ISO weeks held 66% of the cold rows at leads up to 48 hours (experiment 94), and the Christmas windows rest on three Christmases (experiment 6). Re-check when a second winter exists.
What we have not settled
- A second validation year. The analogues on top of the offset (-0.066, -0.149 to +0.015) and the heating term need one.
- Battery response to price. Only the largest battery site was testable, and national demand and wind scored at least as well as the price, so the price may be a proxy for them.
- Stage 0 on more than 14 months of ENS and all members, and half-term effects with more than 9 half-terms.
The theme's research plan lists the proposals still waiting.