Experiment 169: the combined calibration fixes, and whether the ensemble spread sets the width
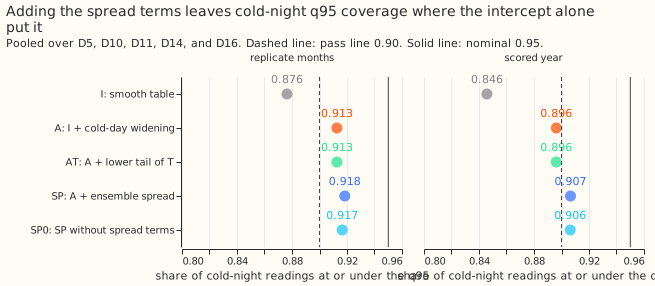
The ensemble spread does not predict how wide the forecast's errors are once the cold-day widening is in place; widening the q95 and q99 offsets by 4% and 10% gives the same cold-night coverage. A quantile is a level of the forecast's error distribution: the q95 is the forecast value that the demand reading should fall at or under on 95% of rows. Its offset is the q95 minus the mean forecast. Coverage is the share of rows on which the reading falls at or under the quantile. A cold night is a winter night (November to March, evening or night hours) whose ERA5 day-mean temperature (the ECMWF reanalysis, an estimate of past weather) is below 2 °C. We asked two questions about the demand forecast that experiment 155 selected as its best. First, do the two calibration fixes found since then work together? They are the smooth spread table of experiment 160 (a table of quantile offsets, read by interpolation along the lead) and the one-sided widening of the upper offsets on forecast-cold days of experiment 164 (fix O). Second, does the spread of the 51-member ensemble weather forecast (how much the members disagree about temperature and about downward shortwave radiation) predict how large the forecast's errors are? We fitted a quantile regression model on the tuning months (the months used to fit every multiplier). We scored it on the scored year (2025-07-02 to 2026-06-29) and on the replicate months (other months of the earlier year), as experiment 164 did. The mean forecast is unchanged. The two fixes combine without loss: the combined forecast reproduces experiment 164's cold-night q95 coverage of 0.896. The spread model lifts that coverage to 0.907, which meets the pre-registered rule in the scored year. In the replicate months the coverage is 0.918. The upper end of the 95% interval of the all-row score change there is +0.0145, which exceeds the allowed +0.0100, so the rule is not met in the replicate months. A control with the spread terms switched off reaches 0.906, so the lift comes from a widening that does not use the spread. Scores are in points of effective capacity (percentage points of each substation's rated demand), and lower is better.
- Arms. I: experiment 160's interpolated spread table. A: I plus experiment 164's fix O
(multipliers 1.65, 1.36, 1.26, and 1.16 on q75, q90, q95, and q99 on forecast-cold days). AT: A
plus the q01, q05, and q10 multipliers of experiment 164's fix T. SP: A with each offset from the
mean multiplied by
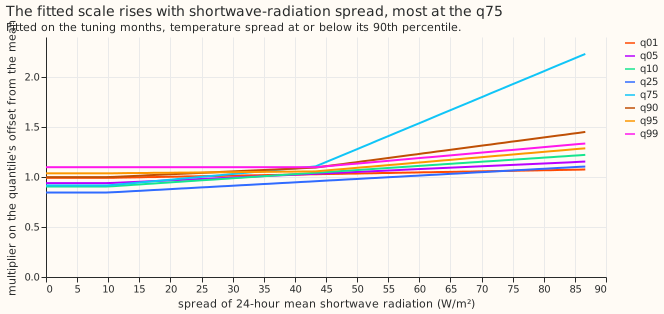
c + sum a_k max(z1 - k1_k, 0) + sum b_k max(z2 - k2_k, 0)for the levels 0.01, 0.05, 0.10, 0.25, 0.75, 0.90, 0.95, and 0.99. Here z1 is the standard deviation across members of the 24-hour mean temperature, z2 the same for shortwave radiation (each divided by its 90th tuning-month percentile), the knots are their 25th, 50th, 75th, and 90th tuning-month percentiles, and a and b are non-negative. SP0 (post hoc control): SP with a and b set to zero, so only the fitted intercept c remains. The pinball loss is linear in the coefficients, so each level is a linear programme (HiGHS) on 150,000 tuning rows. - Row set and schedule.
fold_a_daily_gap_v1, the five decision substations D5, D10, D11, D14, and D16 (D9 beside), leads 0.5 to 168 hours, rows outside the hand-filtered switching events. The mean forecasts are experiment 155's stored monthly refits, so no contrast depends on the retraining schedule. Scored year: 2025-07-02 to 2026-06-29, 464,228 rows at the five substations. The ensemble spreads come from experiment 111's stored 51-member forecasts, which exist at forecast time. The store holds temperature and shortwave radiation, not wind, so the wind spread and the spread of the GAM-K forecast (the additive-model forecast of experiment 111) across members were not tested. - Fitted coefficients. Every fitted intercept
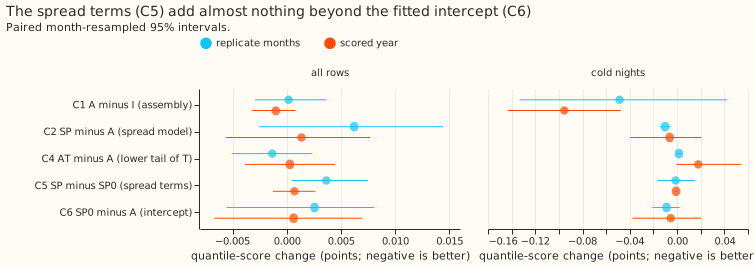
clies between 0.84 and 1.10: 0.99 at q01, 0.94 at q05, 0.91 at q10, 0.84 at q25, 0.92 at q75, 1.00 at q90, 1.04 at q95, and 1.10 at q99. The temperature-spread terms are zero except above the 90th percentile of the spread, where the coefficient is 0.49 (q75), 0.18 (q90), and 0.10 (q95). The shortwave terms are non-zero at every level, at most 0.18 per knot for the lower levels and 0.02 to 0.88 for the upper ones (figure 4). - Contrasts. C1: A minus I (the assembly). C2: SP minus A (the pre-registered test of the spread). C3: SP minus I (descriptive). C4: AT minus A. C5: SP minus SP0 (the spread terms alone). C6: SP0 minus A (the intercept alone). Each is a paired difference in quantile score.
- Assembly (C1, A minus I), scored year. All rows -0.0010 (95% interval -0.0032 to +0.0008); cold nights -0.095 (-0.143 to -0.048); cold-night q95 coverage +0.050 (+0.031 to +0.070). Replicate months: all rows +0.0002 (-0.0029 to +0.0036), cold-night q95 coverage 0.913.
- Spread model (C2, SP minus A), scored year. All rows +0.0014 (-0.0056 to +0.0077); cold nights -0.006 (-0.040 to +0.021); cold-night q95 coverage +0.010. By lead: under 24 hours -0.0011, 24 to 72 hours +0.0006, 72 to 168 hours +0.0024 (-0.0062 to +0.0103). Replicate months: all rows +0.0062 (-0.0025 to +0.0145), cold-night q95 coverage 0.918.
- Control (C5, SP minus SP0, and C6, SP0 minus A). C5, scored year: all rows +0.0007 (-0.0013 to +0.0026); cold nights -0.001 (-0.002 to 0.000); cold-night q95 coverage +0.000. C6: all rows +0.0006 (-0.0067 to +0.0070); cold-night q95 coverage +0.010. Replicate months: C5 all rows +0.0037 (+0.0005 to +0.0075), C6 +0.0026 (-0.0056 to +0.0081).
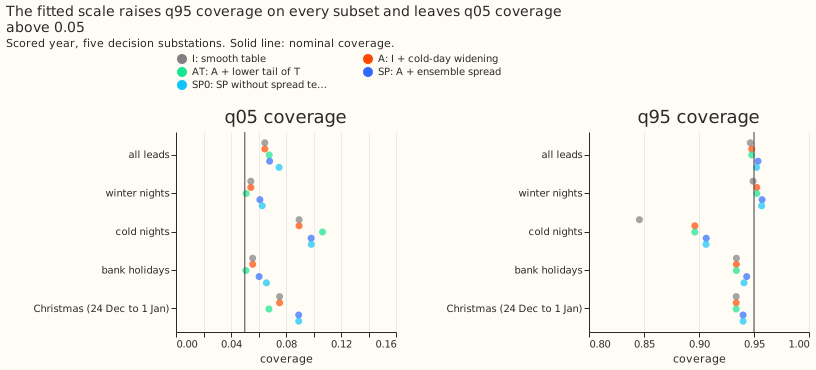
- Lower tail (C4, AT minus A). All rows +0.0003 (-0.0038 to +0.0045); cold nights +0.018 (-0.001 to +0.054). Fix T's lower multipliers raise the cold-night q05 coverage from 0.090 to 0.107, away from 0.05.
- Absolute scores, scored year, all rows. I 2.7529, A 2.7519, AT 2.7522, SP 2.7533, SP0 2.7526, BG2 (the best-guess forecast of experiment 87) 2.7804, manual heuristic 3.4968, climatology 3.8038. Replicate months: I 2.6819, A 2.6821, AT 2.6807, SP 2.6883, SP0 2.6846.
- Tail calibration, scored year, cold nights (coverage / pinball loss). I: q01 0.045 / 0.391, q05 0.090 / 0.950, q95 0.846 / 0.934, q99 0.933 / 0.328. A: 0.045 / 0.391, 0.090 / 0.950, 0.896 / 0.819, 0.959 / 0.282. SP: 0.046 / 0.394, 0.098 / 0.965, 0.907 / 0.798, 0.970 / 0.247. BG2's q95 coverage is 0.756.
- Tail calibration, scored year, all rows (coverage / pinball loss). A: q01 0.022 / 0.216, q05 0.065 / 0.713, q95 0.948 / 0.745, q99 0.982 / 0.232. SP: 0.022 / 0.216, 0.068 / 0.714, 0.954 / 0.748, 0.987 / 0.228. SP0: q05 0.075, q95 0.952. On all rows, C2's q99 loss changes by -0.0042 (-0.0105 to +0.0016) and its q95 loss by +0.0031 (-0.0011 to +0.0073).
- By lead day (q95 coverage, all rows). A: 0.946, 0.948, 0.951, 0.951, 0.952, 0.946, 0.943 for lead days 0 to 6. SP: 0.951, 0.953, 0.955, 0.956, 0.957, 0.952, 0.951. SP changes the median q05 to q95 width by -0.15 to +0.38 points depending on the lead day (wider on 5 of 7 days).
- By hour band (q95 coverage, all rows). A: 0.954, 0.951, 0.934, 0.951 for the four bands in
order (night, morning, midday, evening as
studies.dp_calendarorders them); SP: 0.959, 0.956, 0.941, 0.956. - Bank holidays and Christmas, scored year. Bank holidays (9,812 rows): q95 coverage 0.934 (A) and 0.943 (SP); C2 -0.0044 (-0.0246 to +0.0137). Christmas, 24 December to 1 January (8,641 rows): 0.934 and 0.940; C2 +0.0052 (-0.0172 to +0.0055). The q05 coverage on Christmas rises from 0.075 to 0.089 under SP, so the lower tail is thinner there.
- Curtailment-cost proxy (the node-only rule of
studies.node_curtailmenton each substation's own demand, scaled limit 0.9 times the maximum before the scored year, GBP 2,000 per MWh, leads 12 to 36 hours). Avoidable cost against the perfect forecast, summed over the five substations: I GBP 1.321 million, A 1.272 million, SP 1.310 million, SP0 1.309 million, BG2 1.881 million, manual heuristic 3.332 million. The 95% month-resampled intervals overlap (A 0.11 to 3.14 million), so the proxy cannot rank the arms. A Primary substation has no published export limit here and a demand series is treated as the flow that can breach, so the figures show the arithmetic and are not a curtailment forecast. - What remains miscalibrated. (1) Cold nights: SP's q95 coverage is 0.907 against 0.95 nominal, and its lower tail is thin (q05 coverage 0.098 against 0.05, q01 0.046 against 0.01). (2) The lower tail overall: q05 coverage is 0.065 to 0.075 on all rows in every arm. (3) The coldest forecasts are biased low (experiment 164 found a mean residual of +3.1 points at 0 °C or below), which no scaling of the offsets removes. (4) Economy 7 steps and switching rows were not scored separately here. (5) Christmas lower-tail coverage (0.075 to 0.089).
- Caveats. The scored year's cold-night figure rests on 10 cold days; the day-block 95% interval of SP's coverage is 0.858 to 0.956 and contains 0.90 (the probability of at least 0.90 is 0.61, against 0.45 for A). Leaving out one substation moves SP's cold-night q95 coverage to 0.901 (D5), 0.922 (D10), 0.924 (D11), 0.886 (D14), or 0.903 (D16), so the pass in the scored year depends on D14. In the replicate months SP's all-row upper bound (+0.0145) is over the +0.010 limit, and leaving D10 out gives 0.896. The tuning and replicate months share cold days with each other. The spread model has no quarter or hour-band term, so the prediction that the shortwave coefficients are larger in summer was not tested. SP0 is a post hoc arm, so its pass on both periods is a suggestion, not a pre-registered result. The spread terms do change some quantile scores: C5 is -0.0028 (-0.0043 to -0.0014) at leads under 24 hours in the scored year, and +0.0037 (+0.0005 to +0.0075) over all rows in the replicate months, so they help slightly at short leads and hurt at long leads out of sample.
- What to try next. (1) A bias correction of the mean forecast on days the ensemble forecasts at 0 °C or below. (2) Fit and score the widening over at least two winters. (3) A spread model with hour-band and quarter terms if a wind spread becomes available.
Checks
- Median minus mean forecast, per site, at 12 to 36 hours. Exactly 0.000 for every arm at every substation: the spread table has median zero, and no arm scales the q50 offset.
- Mean-forecast error beside each quantile-score contrast. The mean absolute error of the mean forecast is identical across all arms (contrast 0.0000), because the mean is unchanged.
- Reproduction control. Arm I rescored from experiment 164's stored forecasts scores 2.75291, a gap of 7e-6 from experiment 160's printed 2.7529. Arm A scores 2.75191, a gap of 1e-5 from experiment 164's printed 2.7519. Both are inside the 0.001 cap.
- Prediction check. Cold-night coverage rose by 0.010 (predicted 0.00 to 0.03) and the all-row score by +0.0014 (predicted -0.01 to +0.005): both inside the ranges. The prediction about shortwave against temperature coefficients by quarter could not be tested.
- Audit. A fresh Opus audit re-derived the headline coverages (A 0.8962, SP 0.9066, SP0 0.9064)
and the contrasts from the stored forecasts with its own code, and agreed. Its findings and
triage: (F1) the pass is two rows deep: SP beats A by 56 cold-night rows and the
refutedline is 54, and refitting on a different 150,000-row sample gave +0.0085 (refuted), while a fit on all 361,676 tuning rows gave +0.0108 (partly supported); the verdict stayspartly supported, as pre-registered with the 150,000-row cap, and the margin is recorded here. (F2) SP0's intercepts were fitted together with the spread terms, so a true intercept-only refit is wider (1.03 at q75, 1.06 at q90 and q95, 1.11 at q99), reaches 0.910 (scored year) and 0.921 (replicate months) cold- night q95 coverage, and raises the all-row score by +0.0021 and +0.0066 against A (worse); the conclusion that the widening, not the spread, produces the lift stands, and the advice quotes the refit values. (F3) the month-resampled intervals on cold-night coverage rested on three months and are removed. No leakage, no effect of sorting the quantiles (7 of 484,113 rows), and the leave- one-out figures were confirmed. The audit report is private (data/ml- experiments/briefs/e169_audit_report.md). The audit trigger that fired is the one for a verdict that flips when one site is left out; the other six triggers of theml-experimentskill did not fire.