Curtailment cost
We can now score a demand forecast by the curtailment cost of its errors at a bulk supply point, but the two supply points of the pilot hold too few events to rank forecasts at the headline limit of 0.9 times their earlier maximum export, so no forecast has yet been shown to curtail less there.
Curtailment is the capping of generators beneath a substation when its export would pass a limit. The scoring code plans the caps from a forecast of the substation's export, then charges the energy lost to the caps plus a penalty for export that stays over the limit. Both experiments of the theme are worked examples of that code, and neither had a registered prediction. Experiment 84 ran the scoring code on 2 bulk supply points, Boston and Skegness, and experiment 83 scored the tails of the forecasts of 20 demand series (16 Primary substations, 4 supply points).
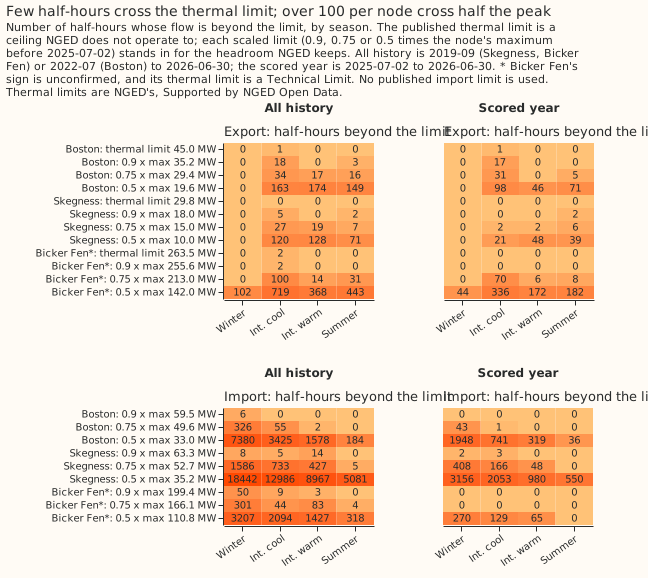
Boston and Skegness together have 19 half-hours beyond 0.9 times their earlier maximum export in the scored year, and more than 100 per node only at half that maximum. The scored year runs from 2025-07-02 to 2026-06-30. The figure counts export and import in separate panels, and also plots Bicker Fen, which is not scored. Source: experiment 84.
Does it work?
The code runs and reproduces a hand-worked answer exactly. All eight quantities of a made-up
half-hour (a 45.0 MW limit and two generators) agree with the hand calculation (experiment
84). The verdict of both
experiments is inconclusive, because neither registered a
contrast.
The pilot cannot rank forecasts at the headline limit. Each arm is a pair of forecasts, one of the substation's export and one of its generators' output. The scaled limit is a fraction of a node's maximum export before 2025-07-02. At 0.9 times, the cost rests on 19 half-hours (all 19 scored), and no difference between arms is significant at the 5% level. At 0.75 times, with 46 half-hours (41 scored), the stack costs GBP 2,440,720 more than the best guess (95% interval 96,371 to 6,686,043). At 0.5 times, with 323 half-hours (268 scored), the best guess costs GBP 10,802,520 less than climatology (-20,880,964 to -3,342,553), and its gap to the NGED baseline includes zero. We have no evidence that NGED operates at 0.5 times, so that limit is a rehearsal (experiment 84). The costs are retrospective, from an energy proxy (generator energy cut plus 20 times the energy left over the limit, at GBP 2,000 per MWh), and are a calibration to history, not a saving.
The two arms are experiment 84's, and match the glossary entries only in part. The stack is the substation forecast fitted once and corrected from its own recent errors, with a generator forecast fitted once. The best guess (weekly retrained) is the substation forecast retrained every week with each generator forecast retrained monthly. Experiment 84 does not state whether either arm applies a half-life or the glossary's spread factor of 1.15.
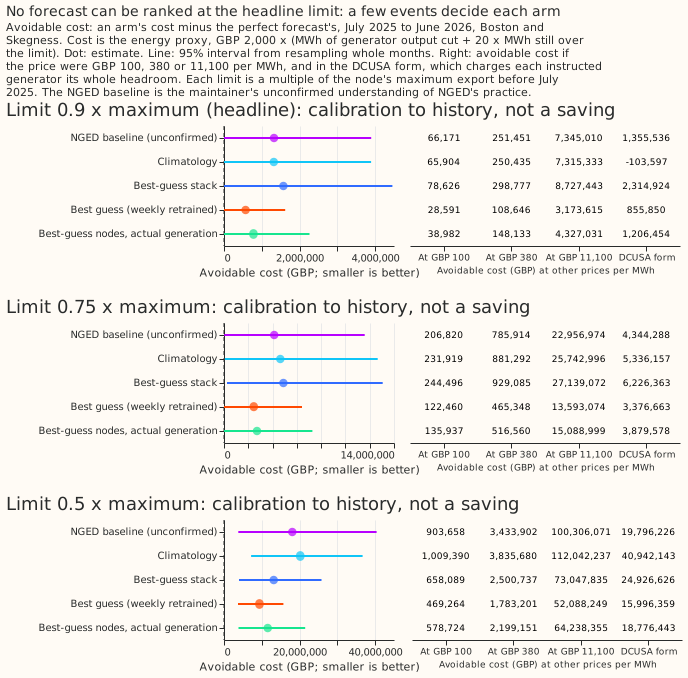
The best guess (weekly retrained) has the lowest avoidable cost of the arms at all three scaled limits, but only some of its gaps are significant. Avoidable cost is an arm's cost minus the perfect forecast's cost, where the perfect forecast has every quantile equal to the metered value. The figure has one panel per scaled limit at GBP 2,000 per MWh, and shorter bars are better. Source: experiment 84.
Most of the best guess's avoidable cost at 0.9 times is breach, not unneeded cuts. Breach is export that stayed over the limit because the forecast did not order enough cuts. Of the GBP 571,823 avoidable cost, 81% is breach: the forecast ordered 13.6 MWh of cuts on event half-hours against 35.1 MWh needed. Another 20% is output cut when metered export was within the limit (experiment 84).
A forecast that fits a whole distribution can plan far more curtailment. In experiment 97, on 17 half-hours at one node (it scores the stored BG2 forecasts of node-only mode, so its count differs from experiment 84's 19), Student-t and skew-normal fits planned 911 and 1,364 MWh of curtailment against 57.5 MWh for the stored forecast, which gave avoidable costs of GBP 2.36 million and 3.12 million against 618,171. The other recalibrations were not separable from the stored forecast (experiment 97).
In an exploratory run, the stored demand forecasts of experiment 48 were too narrow in both
tails. The run pooled 20 demand series, every lead, runs from 2025-07-02, and the arms best guess
stack, manual_heuristic, and climatology. Coverage of the 0.05 quantile was 0.066 to 0.085 and of
the 0.95 quantile 0.891 to 0.927, and weekly retraining had the lowest pinball loss at both levels.
The experiment gives no interval, and the 0.01 and 0.99 levels were not stored (experiment
83, on forecasts stored
by experiment 48). For the later BG2 forecast, q05 coverage reads 0.035 at
the point estimate, which is too wide a lower tail (16 Primary substations, 12 to 36 hours, about 9
months, no interval given; experiment
97).
Best design so far
The only metric design implemented plans caps from the 0.95 quantile of the substation's export forecast and scores at a limit scaled from the node's earlier maximum. The generators beneath the node cut the excess in proportion to their capacity, and the cost is the energy proxy with a breach ratio of 20 (experiment 84). Experiment 84 compared the price and the DCUSA form only, and tried no other quantile, sharing rule, or breach ratio. This is a metric design, not a forecast design: no forecast design curtailed less with significance at the headline limit.
Candidates for production
Nothing is ready. Both experiments are not-for-production. The cost-savings roadmap describes
the metric and the larger delivery that would allow a ranking (cost-savings
metrics).
Gotchas and implementation details
- Score curtailment at the substation, not at a single meter. Experiment 83 first built a single-series metric and withdrew it, because the limit binds at a substation (experiment 83). Otherwise the metric scores each meter against its own history, which does not measure curtailment. Re-check if a per-meter limit becomes known.
- Count the events before ranking. At 0.9 times the maximum only 19 half-hours qualify, and no difference is significant (experiment 84). Otherwise a ranking rests on a few half-hours. Re-check when the delivery of about 2,500 series is scored.
- Score at a scaled limit, and show the published thermal limit as a reference. Boston's export reached its published limit once, and the maintainer's unconfirmed understanding is that NGED curtails early to keep headroom (experiment 84). Re-check if NGED confirms its operating practice (issue #1318).
- Label every cost "calibration to history, not a saving". The perfect forecast still costs GBP 87,460 at 0.9 times, because the cap also removes output above a generator's estimated capacity (experiment 84). Otherwise a cost reads as money NGED would have saved. Re-check if the metric is validated against a real curtailment event.
- The NGED baseline is an assumption. It is the manual heuristic's substation forecast with every generator at full capacity, from the maintainer's unconfirmed understanding of NGED's practice (experiment 84). Re-check once NGED describes its practice.
- Rank under the energy proxy and under the DCUSA form separately. Changing the price does not reorder the arms, but the DCUSA form charges every instructed generator its whole headroom, and climatology's avoidable cost becomes negative under it (experiment 84). Otherwise the choice of cost form decides the ranking unnoticed. Re-check if a different price or cost form is added.
- Report how many generator-half-hours had no forecast. Across the six arms, 13% had none, so those generators were not capped and added to breach (experiment 84). Otherwise a forecast set with more gaps looks worse for that reason alone. Re-check with other forecast sets.
- Report the unscored half-hours. Scoring needs a stored forecast at 12 to 36 hours lead, which drops 5 of 46 events at 0.75 times, and the dropped half-hours hold 14% of the excess energy at 0.5 times (experiment 84). Re-check if the forecast lead window or the stored forecast sets change.
- Check the sign of each node. Boston and Skegness are inferred as import-positive, Bicker Fen's sign is unconfirmed, and Walpole's is unknown, so the metric excludes them (experiment 84). A wrong sign swaps export and import. Re-check when NGED supplies the signs.
- Store the 0.01 and 0.99 quantiles, and score tails with
studies.tail_calibration. The stored sets of experiment 48 stop at 0.95, so the tail table could not be read at 0.99 (experiment 83). Later sets store 11 levels (experiment 97). Re-check if a forecast set again stores fewer levels. - Publish generator figures only as sums over at least 4 generators. Experiment 84 reports no generator singly, and the table joining generators to substations stays in the private data folder (experiment 84). Re-check if a node has fewer than 4 generators.
What we have not settled
- Whether any forecast curtails less than another with significance, once about 2,500 series are scored (the January 2027 delivery).
- How NGED chooses its operating limit, and how it allocates caps among generators.
- Whether the tails of the forecasts are too narrow in general: experiments 83 and 97 disagree on the lower tail, on different forecasts and periods.
The Research plan lists what is planned next, and the Experiments page lists every experiment.