Experiment 202: the two-number solar summary in a rolling replay of the live weather layer
Storing two numbers per half-hour for each weather forecast keeps the whole 2.3% improvement in the daylight quantile score when the numbers are produced the way the live service would produce them. The quantile score measures the forecast's uncertainty bands. The two numbers are the mean and the standard deviation of how much solar generation each of the 51 ensemble members implies (the ensemble is 51 runs of one weather model from perturbed starting conditions), stored as 4-byte floating-point (float32) columns in the weather layer, the part of the service that holds weather data. Two fitted factors per lead band rescale the numbers, and we refitted those factors each month on history that had completed before the month began.
Experiment 193 found that the two numbers keep 98% of the 2.2% daylight gain that running all 51 members gives (experiment 187). Experiment 193 fitted its factors on interleaved months, some later than the months they were applied to, and held the numbers in 8-byte (float64) precision. Here we replayed the scored year of experiment 193: for each month, the factors came from the trailing 365 days of runs whose last valid time (origin plus 168 hours) was before the month's first origin, the two columns were rounded to float32, and each run used only its own 00 UTC ensemble run (published 9 hours before the origin). The score is the quantile score (twice the mean pinball loss over 11 quantiles, in points of effective capacity; lower is better). Arm A is experiment 187's full best-guess forecast; arm M passes all 51 members through the solar term; Q2 is experiment 193's two-number arm with fixed factors; R2 is the replay. D5, D10, D11, D14, and D16 are anonymised substations. Each interval is a 95% interval from resampling whole months.
The rule registered before the run was met: R2's daylight change from arm A is -2.30% (interval
-2.96% to -1.61%), under the -1.5% threshold, with all five substations negative. The verdict is
supported.
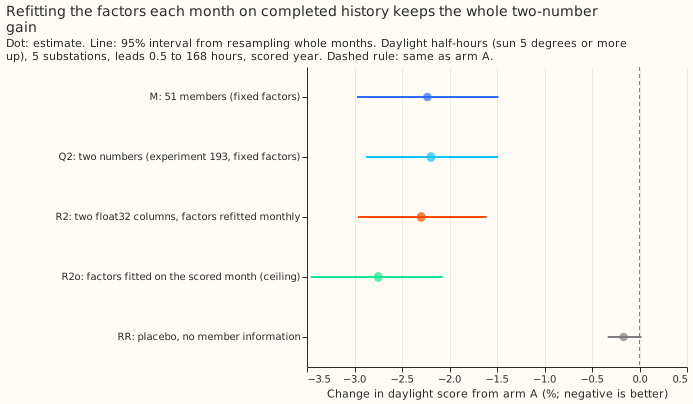
- Arms and row set. A and M are experiment 187's,
read from experiment 184's stored arrays; Q2
is experiment 193's stored arm. R2: Gaussian points from the two float32 columns, factors per lead
band (offset 0.75 to 0.9, spread 1.0 to 1.4, refitted monthly), the fit rows being every stored
run (all substations) of the trailing 365 days that had completed. R2o: factors fitted on the
scored month itself, an in-sample ceiling outside the verdict. RR: placebo with every response
zero. Row set
fold_a_daily_gap_v1, five substations, leads 0.5 to 168 hours, outside switching events; 211,576 daylight rows in 291 complete runs and 12 month blocks (a 13th, 2026-07, holds no daylight row). Monthly refits of the mean forecast (experiment 155) are unchanged. - Headline C1 (daylight, change from arm A). R2 -2.30% (-2.96% to -1.61%); Q2 -2.20% (-2.88% to -1.49%); M -2.23% (-2.97% to -1.48%); R2o -2.75% (-3.46% to -2.07%); RR -0.17% (-0.33% to +0.02%). R2 minus Q2: -0.11% (-0.24% to +0.06%). R2's share of M's gain: 103% (93% to 116%).
- Absolute scores (quantile score, daylight). A 3.632; M 3.551; Q2 3.553; R2 3.549; R2o 3.533; RR 3.626. All rows: A 2.752, R2 2.714. Night 1.981 and twilight 2.299 for every arm, because only daylight rows change.
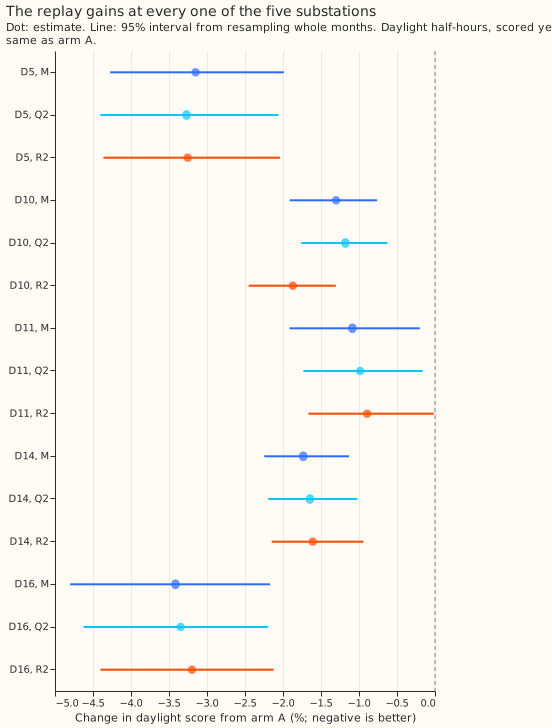
- Substations (daylight, R2; Q2 in brackets). D5 -3.25% (-3.27%); D10 -1.87% (-1.18%); D11 -0.89% (-0.99%), interval -1.67% to -0.01%; D14 -1.61% (-1.65%); D16 -3.20% (-3.35%). Leaving one substation out keeps the change between -1.9% and -2.6% with every interval under zero.
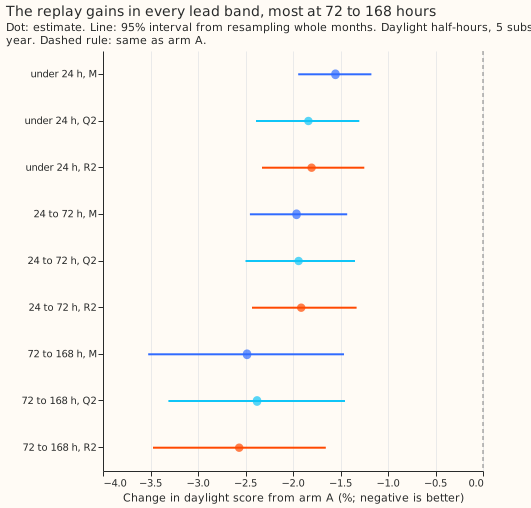
- Lead bands (daylight, R2). Under 24 hours -1.80%; 24 to 72 hours -1.91%; 72 to 168 hours -2.57%. A separate 12 to 36 hour band gives -1.89%. By cloud cover: overcast -0.81% (interval -1.74% to +0.11%), partly cloudy -2.80%, clear -1.96%; the sunniest third -4.75% (-6.92% to -3.18%).
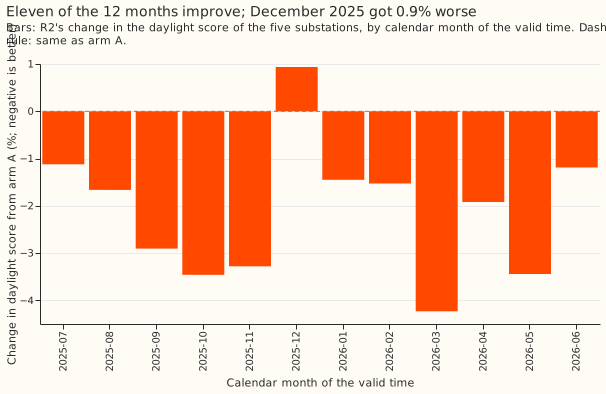
- Months and halves. First six months -2.13%, last six -2.44%, so the early months with less history do not fall short. Monthly changes run from +0.94% (2025-12) to -4.23% (2026-03).
- By valid hour of the day (stand-in for the slot cut). The brief's four 6-hourly forecast slots cannot be scored: the stored forecasts have one origin per run (09:00 UTC after the 00 UTC run), so a 15:00, 21:00, or 03:00 origin would need the forecast stack refitted and re-run, and this experiment does not do that. By valid hour (UTC): 06 to 09 -1.88%; 09 to 12 -2.50%; 12 to 15 -2.08%; 15 to 18 -2.93%; 18 to 21 -0.62% (interval -1.16% to +0.12%).
- Tails (daylight; coverage / pinball loss). R2: q01 0.016 / 0.236, q05 0.058 / 0.838, q95 0.941
/ 0.877, q99 0.983 / 0.245. Q2: 0.013 / 0.233, 0.051 / 0.839, 0.947 / 0.879, 0.986 / 0.242. A:
0.027 / 0.265, 0.078 / 0.907, 0.933 / 0.924, 0.979 / 0.262. Daylight q05-to-q95 coverage: A 0.854,
Q2 0.896, R2 0.883 (nominal 0.90). The curtailment-cost saving against
manual_heuristicwas not scored, because the experiment changes daylight band widths on stored rows and writes no node-level forecast frame. - Gates. G1: the copied code with experiment 193's fixed factors reproduces its stored Q2 to 7.6e-06 (largest quantile difference). G2: float32 against float64 columns changes the daylight quantile score by 1.2e-10. G3: every run's initialisation plus 9 hours is at or before its origin (derived from the run index, so the gate checks the date arithmetic only). G4: RR recovers 7% of R2's gain, under 20%. G5: the fit code run on experiment 193's tuning rows with float64 columns returns experiment 193's four stored factor pairs exactly, so the monthly fit is a test of the same code path. G1 tests the apply path only. All pass.
- Checks. The median forecast minus the mean forecast at 12 to 36 hours for R2 is -0.14 (D5), -0.03 (D10), -0.05 (D11), -0.04 (D14), and -0.05 (D16) points, the same pattern as Q2; arm A is 0.000. R2 shares its mean forecast with Q2 (arm A's mean plus the mean response), whose daylight mean absolute error changed by -0.13% (-0.45% to +0.27%) in experiment 193, the same direction as the score. No audit trigger fired: no control failed (RR moved the score by -0.17% against a half-width of 0.18); R2 matches its prediction (-2.30% against an expected -1.9% to -2.2%) and experiment 193's; the leave-one-out check keeps the sign; no nested arm beat its container (R2o, the in-sample ceiling, beats R2 by design); the interval width (1.35 points) matches Q2's 1.39; no later design depends on this headline.
- Caveats. The replay reuses experiment 187's rows and arm A, whose offsets, Kalman state, and 14-day profile were calibrated on the 2024-07 to 2025-06 months, so the fit rows are in-sample for arm A and the scored rows are not (shared with experiments 187 and 193). The switching mask and usable-row filter use hindsight and filter the fit rows as well as the scored rows. The 00 UTC run is the only run used, so the replay does not test a missing or late run. Fit rows pool all seven substations (the scored contrast uses five). The first month (2025-07) has 12 months of history, all of it from one summer. Two cuts (overcast daylight, and valid hours 18 to 21 UTC) have intervals that include zero.
- What to try next. (1) Build the two columns into the weather layer and the serving path, and
measure the runtime saving (prediction that could fail: the stored columns reproduce R2's
score to 0.001 points). (2) Score R2 on the node curtailment metric of
studies.node_curtailment, because the gain is largest at q01 (pinball loss -11%). (3) Re-run the replay at 15:00, 21:00, and 03:00 origins once the forecast stack can be re-run at those origins, to test the slot cut.