Pooled over three wind farms, ERA5's wind gave a slightly lower power error than CEDA's archived UKV, and CEDA's archived UKV temperature was closer than ERA5's at four weather stations
This study asks which of two records of past weather the project's power forecasts should learn from: a global reconstruction of past weather, or the archive of the Met Office's detailed weather model of the United Kingdom. For past wind, a forecast of wind-farm output given the global reconstruction was slightly more accurate at three wind farms in Lincolnshire. The difference is small, comes mostly from one of the three farms, and changes size with how each hour of power is lined up with the weather. The study keeps the global reconstruction for wind because the plan made it the default and the Met Office archive did not clearly beat it. For past temperature, the Met Office archive was closer to the readings at four weather stations. The Met Office model probably takes those stations' readings as input, its finer grid suits a single station by itself, and its advantage shrinks over the hours after each run of the model starts. The choice of temperature record changed forecasts of solar-farm output by a very small amount at most, and that test could not have detected a difference large enough to change the recommendation.
At three wind farms in Lincolnshire, pooled, an XGBoost model (a gradient-boosted tree model) given the 100 m and 10 m wind of ERA5, the reanalysis of the European Centre for Medium-Range Weather Forecasts (ECMWF), had a lower power error than an XGBoost model given the Met Office's UK variable-resolution (UKV) 10 m wind and 925 hPa wind (the wind at a fixed pressure level above a turbine's hub height) from the archive of the Centre for Environmental Data Analysis (CEDA), by 0.125 percentage points of capacity [+0.033, +0.216]. The power error is the XGBoost model's mean absolute error as a percentage of each farm's capacity, so at a farm of 100 MW a difference of 0.125 points is 0.125 MW of mean absolute error. The brackets hold the 95% interval at the primary hyperparameter setting, one of two fixed, untuned choices of the XGBoost model's tree depth, learning rate, and number of rounds. The second setting gives [+0.035, +0.217]. The difference is statistically significant at the 5% level and smaller than the 0.16-point margin, the smallest difference that the study fixed before any result as clear. ERA5 is the planned default. The archived UKV, which the page calls UKV-CEDA, would have needed a clear advantage at both hyperparameter settings to displace ERA5, so by the planned rule the study recommends ERA5 for past wind. The recommendation therefore means that UKV-CEDA showed no clear advantage, not that ERA5's wind is shown to be better. The difference also leans on one farm and on one convention, both post hoc: without the farm labelled W1 it is +0.079 [-0.038, +0.194], which is not statistically significant, and with each hour of power ending at the weather's time label instead of centred on it, the gap is +0.262 [+0.178, +0.345]. UKV-CEDA is a 6-hourly archive read at leads of 0 to 5 hours, where the lead is the hours since the run of the weather model started, so the result says nothing about the hourly UKV archive that Open-Meteo, a public weather-data service, serves at lead 0. The past-wind page found that Open-Meteo archive ahead of ERA5. Two more post hoc results sit beside the planned result. The gap between the two products grows with UKV-CEDA's lead, from -0.058 points at lead 0 to +0.323 points at lead 5. The gap does not shrink when both XGBoost models are given 10 m wind alone (+0.505 points [+0.394, +0.620]), so giving ERA5 a 100 m column does not explain ERA5's advantage.
At the four Met Office stations inside the box of the UKV-CEDA archive that the study downloaded, UKV-CEDA's 1.5 m air temperature was closer to the readings than ERA5's 2 m air temperature, by 0.124 K [0.113, 0.135] in mean absolute error after removing each product's mean error for each station, calendar month, and hour of day, so by the planned rule the study recommends UKV-CEDA for past temperature. Three facts limit that result. UKV probably assimilates the four stations' readings, that is, pulls each run towards them, although the page has not checked which stations UKV assimilates, so the stations are not independent of UKV. A 2 km UKV cell matches a point station better than a 25 km ERA5 cell by itself, and the study cannot separate that advantage from the product. The advantage falls from 0.250 K at lead 0 to 0.035 K at lead 5 (post hoc), and forecast error growing from each 6-hourly run fits that decay as well as assimilation does. The study does not test how large the advantage is away from those stations, or whether the advantage helps a demand forecast. At six solar farms, on the whole row set, the choice between the two temperatures changes an XGBoost model's power error by no more than 0.009 points of capacity in either direction (the 95% interval). That solar test could not have vetoed the recommendation, because temperature's whole gain for solar power is 0.021 points with ERA5's temperature against a 0.06-point margin. The temperature recommendation therefore comes from the planned rule applied to the station scores, not from any improvement in a forecast.
- Wind history: the planned rule gives ERA5, not UKV-CEDA's 6-hourly archive, for the 100 m and 10 m wind that an XGBoost model reads, on a small difference that rests mostly on one farm. The recommendation is a statement about CEDA's archive at these three farms and not about UKV.
- Temperature history: the planned rule gives UKV-CEDA, on an advantage of 0.124 K at four stations that UKV probably assimilates, which falls to 0.035 K at lead 5. No forecast in this study improved by as much as a planned margin (the solar power interval is within 0.009 points, and demand was not tested). A UKV-CEDA history also carries a non-commercial licence, 5 dropped months, and three physics eras (Discussion).
- Training history from 2019: the early-years test, which checks UKV-CEDA's temperature over 2019-09 to 2020-12, passes for UKV-CEDA temperature, and era 0 of the UKV physics (before 2019-12-04) holds only 3 months.
How this page was made. The research question came from a human. Everything else — the code behind every result, the analysis, the figures, and the text — was written by Claude, Anthropic's AI model (for this page, Claude Sonnet 5.5, with shared code from earlier Claude Opus 5.5 and Claude Sonnet 5 sessions). Several independent Claude reviewers have checked the method, the evidence, and the prose adversarially.
Key findings
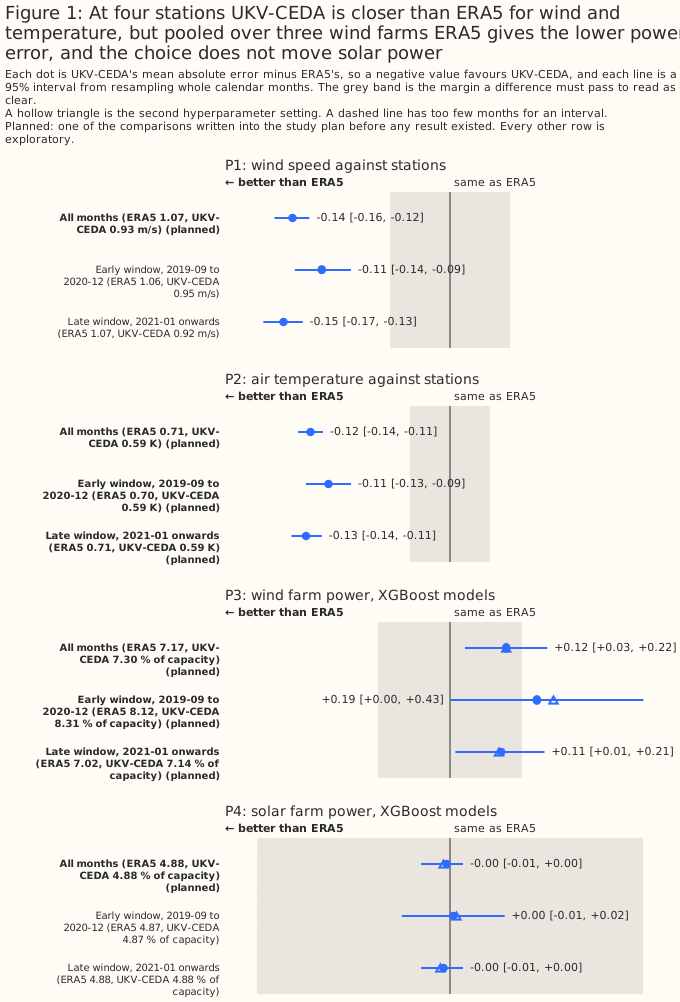
The page names its planned comparisons P1 to P4, in two sets of experiments. Set A scores each product against the station readings directly: P1 is 10 m wind speed and P2 is air temperature. Set B fits XGBoost models and scores their power error: P3 is wind-farm power and P4 is solar-farm power. Every comparison is UKV-CEDA minus ERA5, so a negative value favours UKV-CEDA and a positive value favours ERA5. The planned comparisons, P1 to P4 and P2-lead (a planned split of P2 by lead), were written into the study plan before any result existed. A post hoc row was added after a result was seen, and every other number is exploratory. In P3 each product's XGBoost model reads the wind heights that the product holds, the as-available wind. The post hoc matched pair gives both XGBoost models 10 m wind alone.
The planned wind contrast P3 favours ERA5 by 0.125 points of capacity, which is statistically significant and below the margin (wind). ERA5 is the planned default, and UKV-CEDA did not clear the margin at both settings, so the planned rule gives ERA5. The page does not claim that ERA5's wind is better than UKV's. Without W1 the difference is +0.079 [-0.038, +0.194], and with each hour of power ending at the label it is +0.262 [+0.178, +0.345], both post hoc, so the size of P3 rests on one farm and on the hour convention.
The wind gap grows with UKV-CEDA's lead, from -0.058 points at lead 0 to +0.323 points at lead 5 (post hoc) (lead). From 2024-08-12, the first day of the past-wind page's window, the gap is +0.039 points [-0.115, +0.186], against -0.44 points on the past-wind page. The two studies read different UKV archives at different leads and heights. The page cannot apportion the difference between those causes.
With 10 m wind alone in both XGBoost models, ERA5 is ahead by +0.505 points, so ERA5's advantage does not come from ERA5's XGBoost model being given a 100 m column (matched pair).
UKV-CEDA's temperature is closer at the four stations by 0.124 K, and the advantage falls from 0.250 K to 0.035 K across leads 0 to 5 (temperature). The planned rule gives UKV-CEDA. UKV probably assimilates the four stations, and a 2 km cell matches a point station better than a 25 km cell by itself, so the advantage is not attributed to the product alone. The advantage is not shown to help a demand forecast, and forecast-error growth could explain the decay.
For six solar farms, on the whole row set, the choice of temperature product moves the power error by no more than 0.009 points (solar). The planned veto could not have fired.
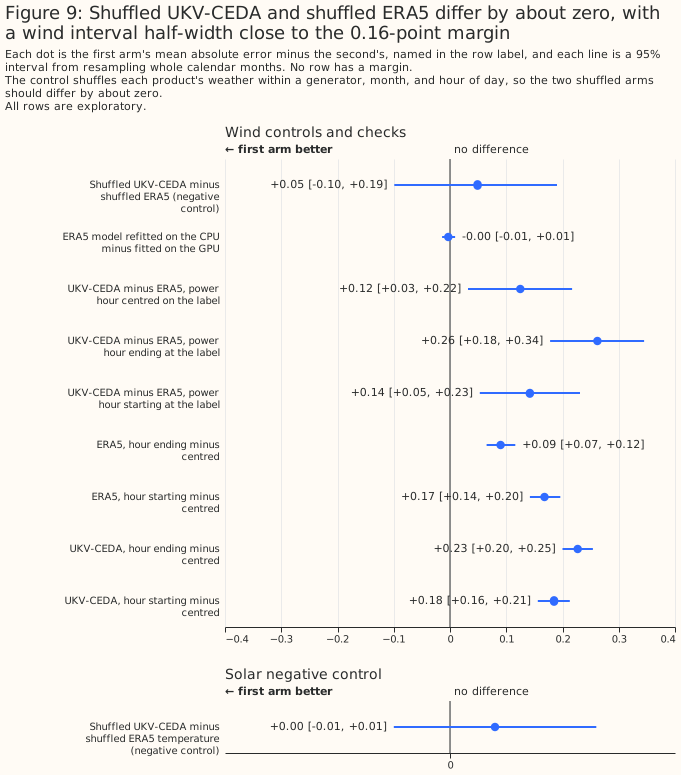
The shuffled-weather controls (XGBoost models given weather shuffled so that the weather carries no information) differ from zero by less than their own noise, and the wind control's interval half-width is close to the wind margin (controls). The decision holds under three power-hour conventions (an hour's power centred on, ending at, or starting at the hour's label), and the size of P3 does not.
A UKV-CEDA training history has costs: 5 dropped months, 3.45% of runs partial, missing, or unlisted, a 6-hourly lead pattern, and three physics eras (costs).
In 2026 the wind difference favours UKV-CEDA at both hyperparameter settings and is statistically significant at one only, in an era whose 8 months are mostly April to September (third era).
Over hours 0 to 5 of UKV-CEDA, the stations favour UKV-CEDA at every lead and power does not (consolidated by lead). The table gives each product's error and the UKV-CEDA minus ERA5 difference by lead 0 to 5 and pooled.
Two further questions, both post hoc, have answers after the results: UKV-CEDA's first leads are closer than ERA5 at the four stations, and no UKV-CEDA minus ERA5 difference shows a trend over the years that the study can attribute to UKV (further questions).
Introduction
The question is whether the main Flexpectation work should take past wind speed and past air temperature from UKV-CEDA or from ERA5. Flexpectation is this project's probabilistic power forecasting for National Grid Electricity Distribution, and its training history, capacity estimates, and historical features read past weather. The main work already takes past irradiance from the satellite retrieval of the Copernicus Atmosphere Monitoring Service (CAMS), and this study does not reopen that choice. The other weather variables in the main work's configuration (dew point, sea-level pressure, surface pressure, 500 hPa height, precipitation type, and windchill) are not scored. No page on this site compares UKV with ERA5 before August 2024, and CEDA's archive starts in September 2019, so the study tests 2019 and 2020 as well.
| Product | Grid | How read | Served lead |
|---|---|---|---|
| ERA5, from Copernicus (wind) and Open-Meteo's copy (temperature) | 0.25 degrees (about 25 km) | The nearest cell at each farm or station; an instantaneous value each hour | An hourly analysis, a best estimate of the weather at that hour rather than a forecast |
| UKV-CEDA, from CEDA's archive of Met Office files in GRIB, the gridded binary format of the World Meteorological Organization | 2 km | The nearest cell, from the freshest run that has started at or before the hour | 0 to 5 hours, because the archive's runs start at 00, 06, 12, and 18 UTC (Coordinated Universal Time) |
The served lead, the lead at which the archive's value is read, is the UTC hour minus the start of the latest 6-hourly run, so a lead is also an hour of day. The 06 UTC hour reads the 06 UTC run at lead 0, never the 00 UTC run at lead 6. CEDA's archive is 6-hourly and read at leads of 0 to 5 hours. The hourly UKV feed that Open-Meteo archives, which the past-wind page used, is read at lead 0, so no result here says how the Open-Meteo feed would perform.
Data and methods
Two sets of experiments answer the question, and the rule that combines them was fixed before any result. Set A scores each product against Met Office station readings, with no machine learning. Set B fits one XGBoost model per metered generator and per product, and scores the model's power error. Four contrasts were planned, P1 to P4, together with P2-lead, a planned split of P2 by lead. Each contrast is UKV-CEDA minus ERA5, with a negative value favouring UKV-CEDA. A planned contrast was written into the study plan before any result existed. Every other number on this page is exploratory, and a row added after a result was seen is also labelled post hoc.
| Label | Set | What it compares | Margin |
|---|---|---|---|
| P1 (planned) | A | 10 m wind speed against the stations; context only, never decides | 5% of ERA5's error on the same rows (0.053 m/s) |
| P2 (planned) | A | Air temperature against the stations; decides temperature | 5% of ERA5's error (0.036 K) |
| P3 (planned) | B | Wind-farm power, as-available wind (the heights each product holds); decides wind | 0.16 points of capacity |
| P4 (planned) | B | Solar-farm power; can veto a UKV-CEDA temperature recommendation | 0.06 points of capacity |
A contrast reads "clear" only if its 95% interval lies wholly on one side of zero and its point estimate passes the margin. Otherwise it reads "small, not clear" (the interval excludes zero but the estimate is inside the margin) or "no clear difference". The set B margins come from the half-widths of intervals published on earlier pages and from the number of scored months. P3 must read the same at both hyperparameter settings. Temperature is decided by P2, provided that P2 is also clear at leads 3 to 5 hours (P2-lead, planned). A clear ERA5 reading of P4 at either setting would veto a UKV-CEDA recommendation. The default is ERA5.
Set A uses four stations, and the score removes each product's bias. The stations are the stations in MIDAS Open, the open release of the Met Office Integrated Data Archive System, whose nearest UKV-CEDA cell lies within 2 km (inside the archive's crop) and that report wind speed and temperature at 90% or more of hours. Four stations qualify. The score is the mean absolute error after removing each (station, product, calendar month, hour of day) mean error, which in set A plays the part of an XGBoost model that learns each farm's bias. A 2 km cell still represents a point better than a 25 km cell, so set A does not attribute a UKV-CEDA advantage to the product alone. The report also prints the raw error and the error after removing each (station, product, calendar month) mean. ERA5 wind at one station ends in December 2023, so the wind rows number 182,521 station-hours and the temperature rows 200,035.
Set B gives each XGBoost model the same rows and the same number of columns. The wind rows number 145,758 farm-hours over three farms (W1 to W3), the solar rows 122,890 farm-hours over six farms (A to F), and each holds 78 scored months. Each wind XGBoost model has 7 input columns: the hour of day, the day of year, the UKV era, and 4 weather columns. The ERA5 XGBoost model reads the 100 m speed, the sine and cosine of the 100 m direction, and the 10 m speed. The UKV-CEDA XGBoost model reads the 10 m speed, the sine and cosine of the 10 m direction, and the 925 hPa speed, because the archive holds no 100 m wind. The wind contrast therefore mixes product, height, and served lead, and the page claims no cause. Each solar XGBoost model has 10 columns and differs only in the temperature: the solar geometry (the sun's zenith and azimuth angles and the irradiance at the top of the atmosphere), the hour of day, the day of year, the era, the temperature, and CAMS's global, beam, and diffuse irradiance. Column subsampling is off, so an XGBoost model with more columns gets no free advantage.
The rows are decided by the target and by availability, never by a product's values. An hour is kept only if the target exists and every XGBoost model's input exists. The wind rows drop every hour that holds an exactly zero half-hour, because two farms' feeds changed in 2026. The solar rows drop the zero half-hours, one corrupt block of an unrelated product, the end of January 2026, and a commissioning ramp. Of the solar rows, 398 are hours when the network operator had curtailed export. The fit excludes those hours from training and still scores them. Wind power is the hour centred on the label and solar power the hour ending at the label. The study drops the 12 days from 2021-12-01 to 2021-12-12, when Open-Meteo's copy of ERA5 temperature disagrees with Copernicus by up to 2 degrees Celsius, from every set.
Five months are dropped from every set because UKV-CEDA's runs are missing or partial. A month that loses more than 25% of its hours to incomplete runs is dropped. An incomplete run is never replaced by an older run, because the older run would change the lead part-way through the record. The 5 months are 2020-03 (33% of hours lost), 2022-09 (49%), 2022-10 (33%), 2022-12 (56%), and 2023-05 (26%). The decision to drop the 5 months, which keeps the planned limit, was taken by the maintainer's delegate after the implementer had seen the set A tables in memory. Review judged the choice neutral between the two products. Two more months straddle a change of UKV's physics and are dropped too: 2019-12 and 2026-01.
The folds are blocks of whole months inside each of three UKV eras. Each fold is predicted by an XGBoost model trained on the other folds, so every score comes from months that the XGBoost model did not train on. The Met Office changed UKV's physics on 2019-12-04 and 2026-01-21, so era 0 is September to November 2019 (3 scored months), era 1 is 2020-01 to 2026-01 exclusive (67 months), and era 2 is 2026-02 onward (8 months). Each era is cut into five folds of whole months, and the fold rotation covers every calendar month with a training row. The era is also a column of every XGBoost model. The study did not search again for PS44, a Met Office parallel suite (a numbered package of operational model changes) that the repository does not record and that may have changed UKV's physics. The repository's roadmap records that no date or content for PS44 could be found.
Each XGBoost model is fitted three times at each of two hyperparameter settings. The primary
setting is max_depth 6, learning_rate 0.05, subsample 0.8, min_child_weight 20, reg_lambda
1, and 500 rounds. The second setting is max_depth 4, learning_rate 0.03, subsample 0.8,
min_child_weight 50, reg_lambda 5, and 1,200 rounds. Neither setting was tuned. Each fit uses
seeds 0, 1, and 2, and every planned contrast is fitted at both settings. The error is the mean
absolute error as a percentage of the generator's capacity, each row divided by its own generator's
capacity before any mean.
Each 95% interval resamples whole calendar months and the fitting seed. The resampling is paired across the two XGBoost models, draws one of the three fitting seeds, and runs 2,000 times. The interval covers month-to-month weather and the seed, and does not cover differences between generators or between places.
Three checks measure the noise the contrasts sit in: a shuffled-weather negative control, a power-hour scan, and a refit on the central processing unit (CPU). The negative control shuffles a product's weather columns within a generator, a year-month, and an hour of day (jointly for the four wind columns, and for temperature only in the solar rows, which leaves CAMS's irradiance intact). Two shuffled XGBoost models carry no weather information, so their difference should be about zero. The power-hour scan refits both wind XGBoost models on one row set with the power of the hour centred on the label, ending at it, and starting at it. One ERA5 wind XGBoost model was refitted on the CPU, to measure the difference between a fit on the graphics processing unit (GPU) and a CPU fit.
Several post hoc analyses were added after the first results, and Limitations lists them all. The post hoc analyses are single-lead and leave-one-out rows, the analysis-only refits (each product's XGBoost model trained and scored on the lead-0 rows, or the lead-0 and lead-1 rows, alone), a straight-line slope per year through the monthly mean differences (the interval resamples whole months, or runs of 6 or 12 months), and the matched 10 m pair.
Every XGBoost model was fitted on one NVIDIA RTX A6000 GPU with XGBoost 3.4.1, apart from the CPU refit. The fits ran on 2026-10-06. GPU and CPU results are not bit-identical, so the page keeps one device inside each planned contrast.
The post hoc and exploratory rows are labelled, and the study does not correct for multiple comparisons. A row with no real effect behind it has a nominal 5% chance of reaching the 5% level, and the number of such rows is unknown. The rows share their months, so spurious results cluster. The page counts how many splits reach the 5% level in Limitations.
Results
The XGBoost models track measured power at every farm
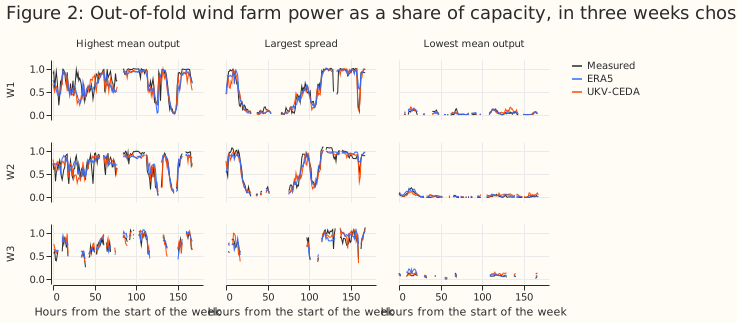
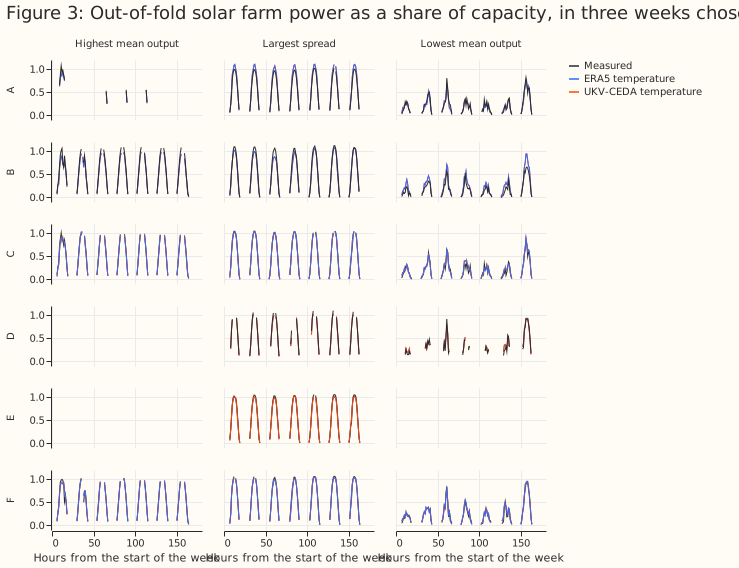
The out-of-fold predictions (each made by an XGBoost model that did not train on that fold) follow the measured output of every generator in all three weeks chosen by rule. The rule picks the week of highest mean output, the week of the largest spread of output, and the week of lowest mean output, pooled over the generators. The wind weeks fall in February 2020 (highest mean output and largest spread) and March 2022 (lowest mean output). The solar weeks fall in May 2020 (highest), April 2025 (largest spread), and August 2021 (lowest). Figures 2 and 3 show the six weeks. A gap in a line is an hour dropped from the rows.
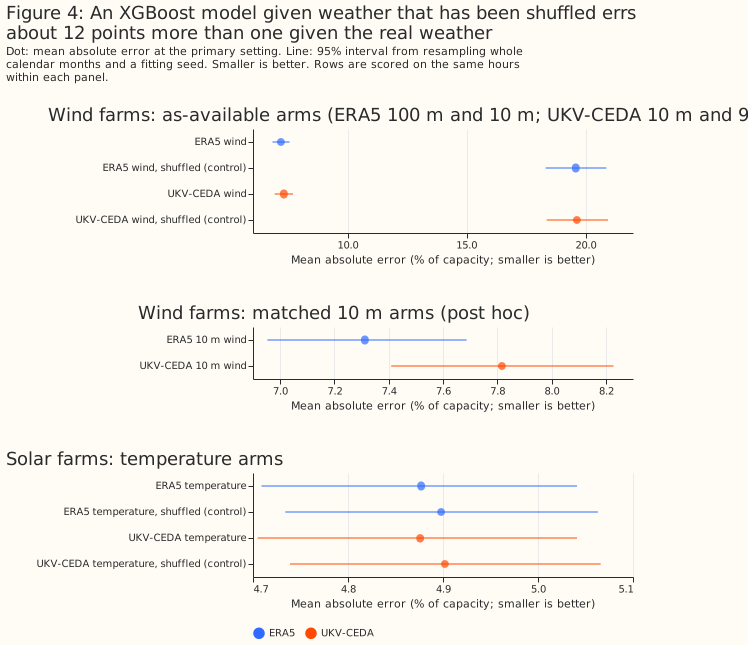
Every XGBoost model's own error is reported, and the shuffled-weather wind models err about 12 points more. The wind XGBoost models given real weather have mean absolute errors of 7.174% (ERA5) and 7.299% (UKV-CEDA), against 19.589% and 19.637% when their weather columns are shuffled. The solar XGBoost models given real temperature err by 4.877% (ERA5) and 4.876% (UKV-CEDA), against 4.898% and 4.902% when the temperature is shuffled, so temperature alone adds little for solar power. Figure 4 shows the errors at the primary setting. The matched 10 m XGBoost models err by 7.312% (ERA5) and 7.817% (UKV-CEDA).
ERA5 gave the lower wind-power error by 0.125 points
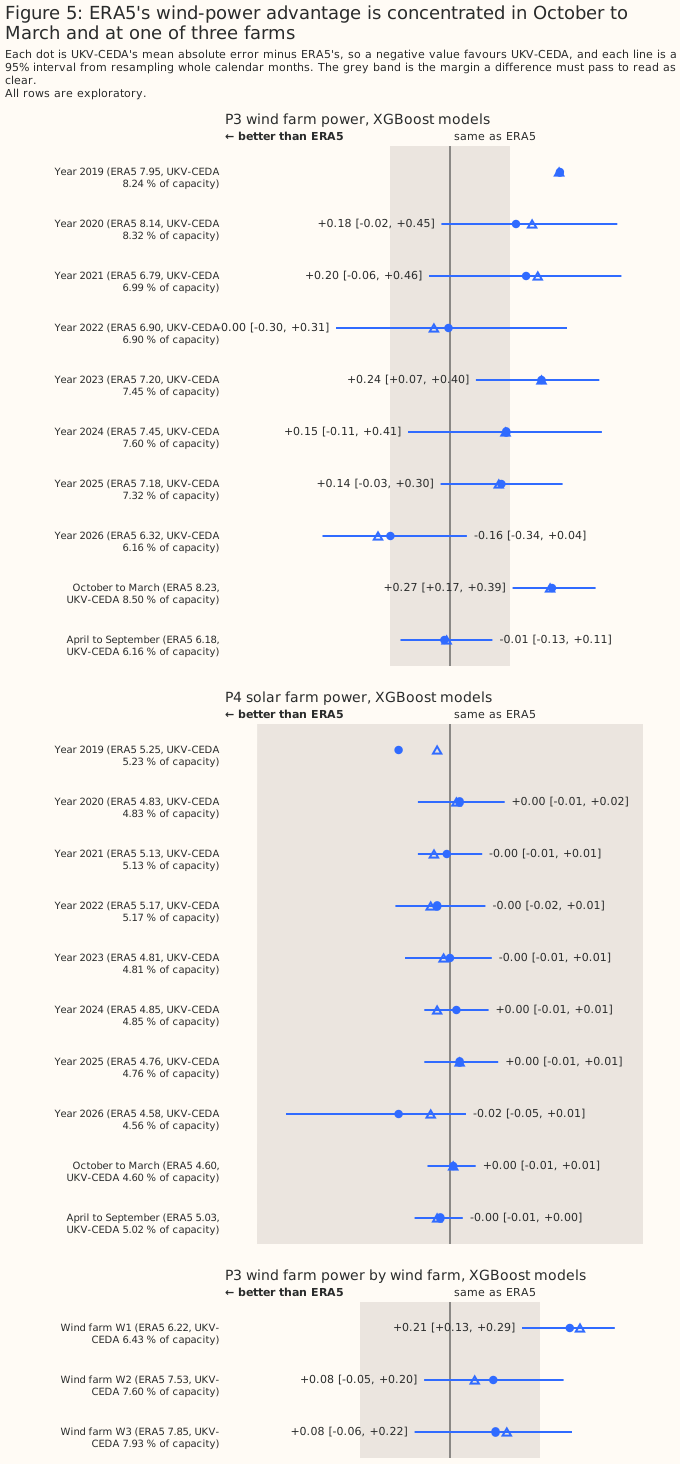
P3, the planned wind contrast, is +0.125 points [+0.033, +0.216] at the primary setting and +0.125 points [+0.035, +0.217] at the second, so the XGBoost model given ERA5's wind has the lower error. Both intervals lie above zero, so the difference is statistically significant at the 5% level. Both estimates lie below the 0.16-point margin, so the reading is "small, not clear". The planned rule gives ERA5 for wind. The small advantage of the XGBoost model given ERA5's wind cannot be attributed to the product alone, because the two XGBoost models differ in height and served lead as well.
P3 favours ERA5 in the early window, in the late window, and when the zero hours are kept. P3's early window (2019-09 to 2020-12, 14 months) is +0.193 [+0.001, +0.430] at the primary setting, which reads "clear" for ERA5, and +0.230 [+0.043, +0.443] at the second. P3's late window is +0.114 [+0.012, +0.210] and +0.109 [+0.010, +0.205] at the two settings. One replication refits both XGBoost models on rows that keep the hours holding an exactly zero half-hour. This keep-zero-hours replication gives +0.132 [+0.043, +0.218] (7.209% for ERA5 against 7.340% for UKV-CEDA).
The advantage is concentrated in October to March and at one of the three farms (exploratory). From October to March the difference is +0.272 points [+0.167, +0.388], and from April to September the difference is -0.015 points [-0.132, +0.113]. At W1 the difference is +0.213 [+0.128, +0.293], at W2 +0.077 [-0.046, +0.202], and at W3 +0.081 [-0.063, +0.217]. Leaving one farm out (post hoc) gives +0.079 [-0.038, +0.194] without W1, +0.151 [+0.056, +0.244] without W2, and +0.143 [+0.056, +0.233] without W3. The pooled result therefore leans on W1, and the page's claim is about the three farms together. By year the difference is +0.293 (2019, 3 months, no interval), +0.176 (2020), +0.203 (2021), -0.004 (2022), +0.244 (2023), +0.150 (2024), +0.137 (2025), and -0.159 (2026). Only 2023 has an interval wholly above zero. A stable winter boundary layer, where neither 10 m nor 925 hPa wind stands in for hub height, would fit the winter concentration. The boundary-layer explanation is a hypothesis, not a finding.
The wind gap grows with the served lead
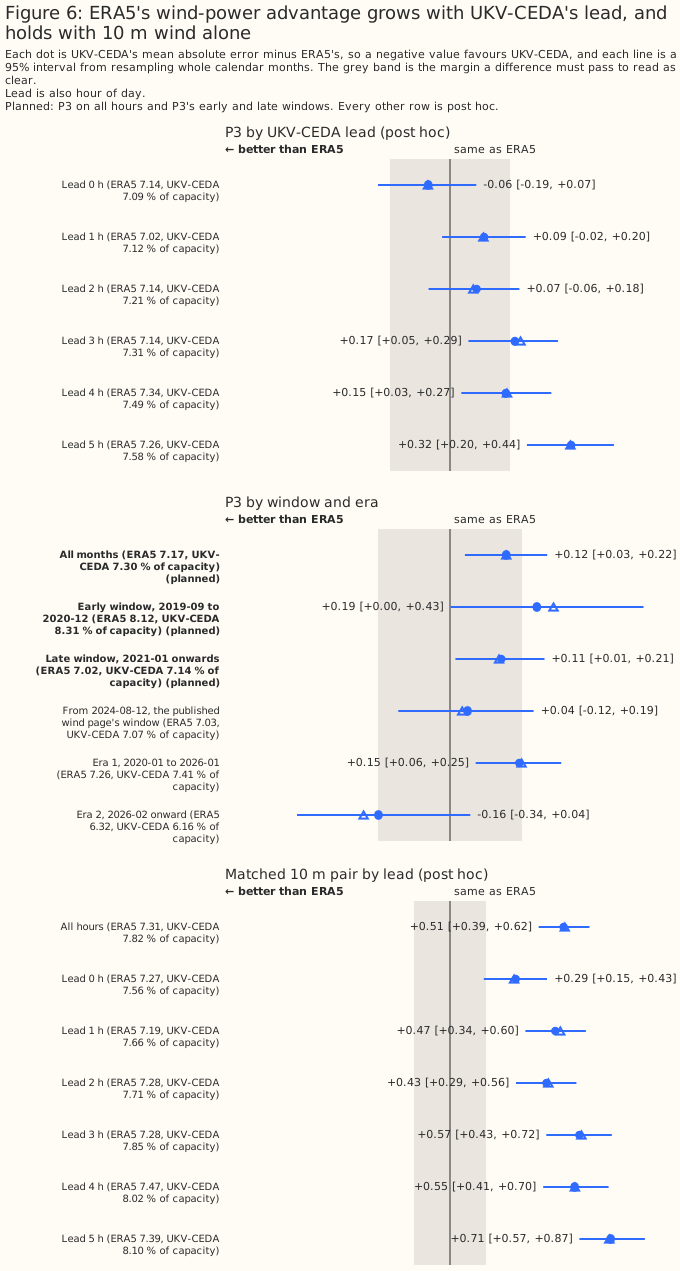
The difference rises from -0.058 points at lead 0 to +0.323 points at lead 5 (post hoc). The six rows are -0.058 [-0.192, +0.070], +0.091 [-0.021, +0.202], +0.071 [-0.057, +0.185], +0.173 [+0.049, +0.288], +0.149 [+0.030, +0.270], and +0.323 [+0.205, +0.437] for leads 0 to 5, at the primary setting.
The gap drops between adjacent hours at each run boundary, so lead, not hour of day, is the likelier reading (post hoc). Each lead pools 4 UTC hours spread across the day, so only a diurnal cycle that repeats every 6 hours could masquerade as lead. P3 by UTC hour runs from +0.436 at 05 UTC to +0.072 at 06 UTC, from -0.043 at 11 UTC to -0.322 at 12 UTC, from +0.473 at 17 UTC to -0.138 at 18 UTC, and from +0.429 at 23 UTC to +0.170 at 00 UTC. ERA5's own wind-power error ranges from 6.45% to 7.98% across the 24 UTC hours and from 7.02% to 7.34% across the six leads. Hour of day still moves ERA5's error, so the page calls lead the likelier reading and not the proven one.
From 2024-08-12, the first day of the past-wind page's window, the difference is +0.039 points [-0.115, +0.186], and the past-wind page's -0.44 is not a difference in period. The past-wind page found Open-Meteo's UKV ahead of ERA5 by 0.44 points [0.24, 0.63] over the same days. Open-Meteo serves UKV at lead 0 every hour with a hub-height wind, whereas CEDA's archive is 6-hourly, with leads of 0 to 5 hours and only 10 m and 925 hPa wind. The studies also use different column sets and a different source of ERA5 wind (Open-Meteo's copy against Copernicus). The page cannot say how much of the gap each difference explains.
Giving both XGBoost models 10 m wind alone widens ERA5's advantage
With each product's 10 m wind alone, ERA5 is ahead by +0.505 points [+0.394, +0.620] at the primary setting and +0.510 [+0.398, +0.624] at the second, so ERA5's advantage does not come from ERA5's XGBoost model being given a 100 m column (post hoc). The two matched XGBoost models each have 6 columns: the 3 shared columns and the 10 m speed, sine, and cosine. ERA5 is ahead in the matched pair at every lead (+0.292 at lead 0 to +0.714 at lead 5), in the early window (+0.577) and the late window (+0.494), and from 2024-08-12 (+0.366 [+0.196, +0.534]). At lead 0 UKV-CEDA still trails in the matched pair (+0.292), while the as-available pair is level there (-0.058). At lead 0, therefore, the column sets, mostly UKV-CEDA's 925 hPa column, bring the as-available pair level, and the lead does not. The UKV-CEDA 10 m XGBoost model errs by more (7.817%) than the as-available UKV-CEDA XGBoost model that also reads 925 hPa wind (7.299%). The planned P3 gap (+0.125) is therefore smaller than the matched-pair gap (+0.505).
The matched pair does not show that height is irrelevant. UKV-CEDA's 10 m wind is closer to the stations' 10 m readings than ERA5's (P1, -0.140 m/s) yet a worse predictor of farm power. A 2 km surface wind that decouples from hub-height flow may explain the difference. The matched pair is post hoc and does not change the planned decision.
UKV-CEDA's temperature is closer at four stations, and less so at longer leads
P2, the planned temperature contrast, is -0.124 K [-0.135, -0.113], so UKV-CEDA is closer than ERA5 to the stations' readings. The mean absolute error after removing bias is 0.711 K for ERA5 and 0.587 K for UKV-CEDA over 200,035 station-hours. The margin is 0.036 K, so the reading is "clear". The raw errors are 0.845 K and 0.626 K. P2's early window is -0.108 [-0.128, -0.088] and its late window -0.128 [-0.141, -0.114], both planned. The pre-registered row P2-lead splits P2 by lead: -0.187 K [-0.198, -0.176] at leads 0 to 2 and -0.061 K [-0.075, -0.047] at leads 3 to 5. The planned condition that P2 is clear at leads 3 to 5 is met. Set A's wind contrast P1 is -0.140 m/s [-0.156, -0.125] (0.925 m/s for UKV-CEDA against 1.066 for ERA5). P1 never decides.
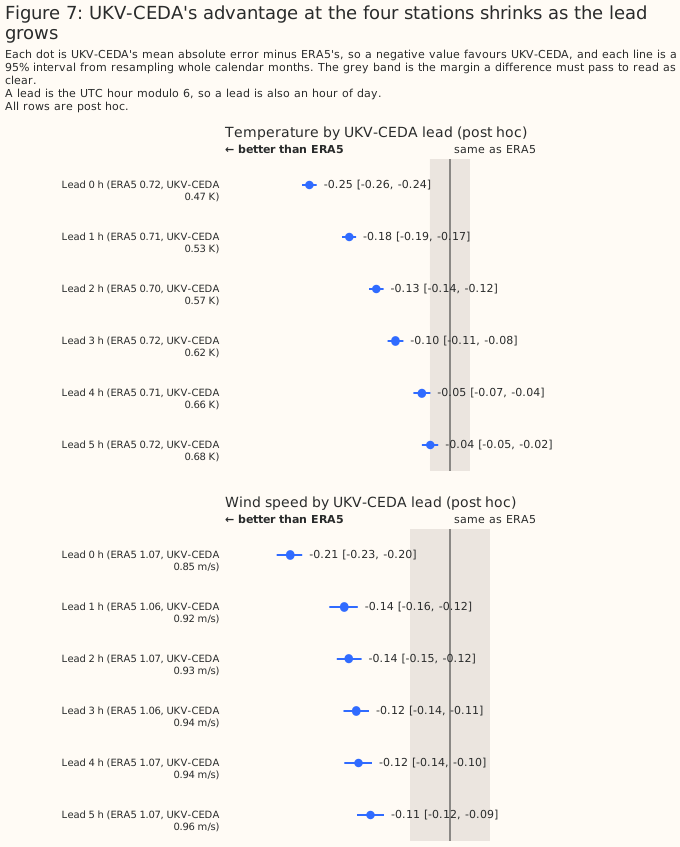
The advantage shrinks steadily with lead, from -0.250 K at lead 0 to -0.035 K at lead 5 (post hoc). The six rows are -0.250 [-0.263, -0.237], -0.179 [-0.192, -0.167], -0.131 [-0.144, -0.118], -0.097 [-0.111, -0.083], -0.050 [-0.065, -0.035], and -0.035 [-0.050, -0.021] K for leads 0 to 5, while ERA5's error stays between 0.702 K and 0.718 K. At lead 5, the least favourable lead for UKV-CEDA, the advantage is 0.035 K, inside the 0.036 K margin. The wind advantage decays more slowly, from -0.213 to -0.106 m/s.
Two explanations fit the decay, and the page tests neither. The four stations' readings may enter UKV's hourly data assimilation, so the analysis is closest to those stations' readings. The page has not checked which stations UKV assimilates. Forecast error also grows with lead from each 6-hourly run, while ERA5 is an analysis at every hour, so UKV-CEDA would lose ground with lead even if UKV assimilated none of the four stations. ERA5's own screen-level analysis may also use the same stations.
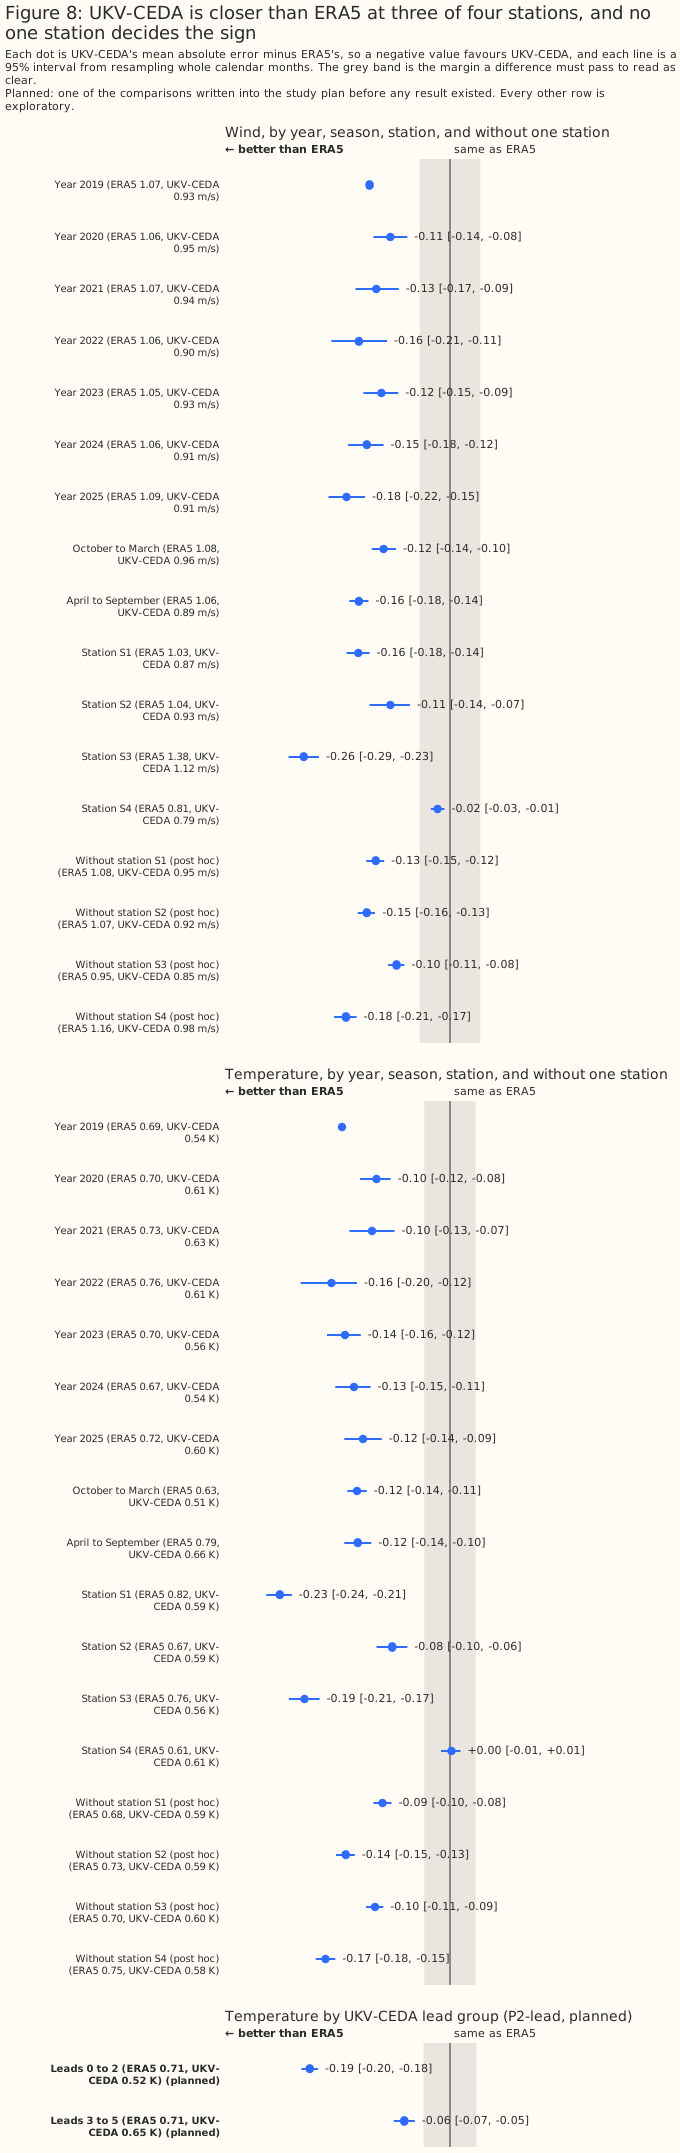
No single station decides the sign, but the stations differ a great deal. UKV-CEDA's temperature is closer at stations S1 (-0.227 K [-0.245, -0.211]), S3 (-0.194 K), and S2 (-0.077 K), and level at S4 (+0.002 K [-0.012, +0.014]). The planned contrast therefore rests on three of four stations. Leaving one station out moves P2 between -0.166 K and -0.090 K, and wind between -0.185 and -0.095 m/s. The interval on P2 (±0.011 K) covers month-to-month weather at four stations only. By year P2 runs from -0.098 K (2020) to -0.158 K (2022). From October to March P2 is -0.124 K, and from April to September -0.123 K. Figure 8 shows each split.
Solar power does not depend on the temperature product
P4, the planned solar contrast, is -0.001 points [-0.009, +0.004] at the primary setting and -0.002 points [-0.006, +0.002] at the second, which reads "no clear difference". On these six farms the choice of temperature product moves the error by no more than 0.009 points at either setting, on the whole row set. The refit on leads 0 to 1 alone reaches -0.010 [-0.020, -0.001].
The planned veto of a UKV-CEDA temperature recommendation could never have fired. The XGBoost model's whole gain from temperature is 0.021 points for ERA5's temperature (against its own shuffled copy) and 0.026 points for UKV-CEDA's. A clear ERA5 reading needed a difference above 0.06 points, 2.9 times ERA5's whole gain. P4's information is its bound, and the page does not count P4 as evidence for the temperature recommendation. P4's early window is +0.001 [-0.015, +0.017] and its late window -0.002 [-0.009, +0.004]. The solar XGBoost models were not given demand, so the study cannot say how temperature helps a demand forecast.
The controls show no bias, but too much noise to validate small differences
The negative controls differ from zero by less than their own intervals, and the wind control's interval half-width is close to the wind margin. The shuffled UKV-CEDA XGBoost model minus the shuffled ERA5 XGBoost model is +0.049 points [-0.099, +0.190] for wind and +0.004 points [-0.005, +0.013] for solar. Neither interval excludes zero, so the controls show no systematic bias between the two products' pipelines. The two shuffled wind XGBoost models err by about 19.6%, nearly three times the real XGBoost models' 7.2%, so the shuffled models' noise says little about a pipeline that runs at 7%. The wind control's interval half-width is about 0.14 points, close to the 0.16-point margin, so a difference of P3's size (+0.125) would not stand out against the shuffled models' noise.
P3 rests on its own paired interval and on the refit on the CPU, not on the shuffled control. P3's own paired interval is [+0.033, +0.216], and [+0.035, +0.217] at the second setting. The better noise floor is the refit of the same ERA5 wind XGBoost model on the CPU, which differs from the GPU fit by -0.003 points [-0.014, +0.009]. Read P3 as a small difference that the study can resolve, and not as a difference that the shuffled control validates.
Sixteen of the 19 controls and replications are statistically significant, and that is expected. The three that are not are the two negative controls and the refit on the CPU. Four of the 16 are each product's XGBoost model against its own shuffled copy (wind -12.415 points for ERA5 and -12.339 for UKV-CEDA, solar -0.021 and -0.026), significant because real weather carries information that shuffled weather does not. The other 12 are the power-hour checks and the keep-zero-hours replications. A power-hour offset measures the convention and says nothing about the products, because moving the hour is expected to change the error. A replication of P3 is significant because P3 is.
The decision holds under three power-hour conventions, and the size of P3 does not. On one row set of 143,555 farm-hours, the UKV-CEDA minus ERA5 wind gap is +0.125 [+0.032, +0.217] with the hour centred on the label, +0.262 [+0.178, +0.345] with the hour ending at the label, and +0.142 [+0.053, +0.231] with the hour starting at it (post hoc). Ending the hour at the label raises ERA5's error by +0.090 [+0.065, +0.116] and UKV-CEDA's by +0.227 [+0.200, +0.254]. Starting the hour at the label raises ERA5's error by +0.168 [+0.142, +0.196] and UKV-CEDA's by +0.185 [+0.156, +0.213]. The centred hour has the lowest error for both products. The centred hour is also the convention that matches an instantaneous wind value. UKV-CEDA trails ERA5 under all three conventions, so the decision does not depend on the convention. The size of P3 does: UKV-CEDA loses more than ERA5 when the hour ends at the label, so a half-hour misalignment would enlarge the gap. No control is within 20% of its interval's width of zero, so no control needed the second-setting rerun.
In 2026 the wind difference favours UKV-CEDA, statistically significantly at one setting only
In era 2 (2026-02 onward, 8 months), the wind difference is -0.159 points [-0.340, +0.045] at the primary setting and -0.192 points [-0.354, -0.009] at the second, so the difference favours UKV-CEDA and is statistically significant at the second setting only (post hoc). Era 2 is the closest era to today's UKV, and the page names era 2 as a candidate for a follow-up. Of era 2's 8 months (2026-02 to 2026-09), 6 fall in April to September, where P3 over all years is -0.015 [-0.132, +0.113]. Era 2 holds one partial year, so the result could be one unusual season. Era 2 is exploratory, and its folds trained mostly on era 1. Set A holds no station data from era 2 (the stations' record ends in December 2025), so P1 and P2 say nothing about era 2. Era 1 gives +0.154 [+0.057, +0.247], and era 0, which has 3 months, +0.293 with no interval.
Monthly series show no step from a change of UKV, and the station comparisons step together in 2021
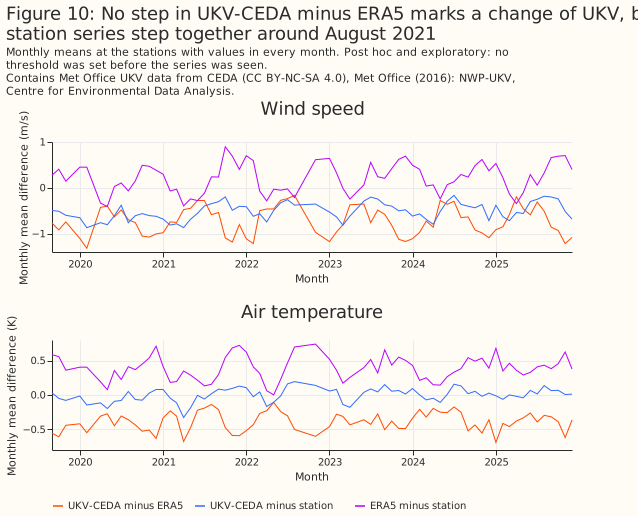
No step in UKV-CEDA minus ERA5 marks a change of UKV, but UKV-CEDA minus the station and ERA5
minus the station step together around August 2021 (post hoc). verify.md lists the months that
start the largest differences between the mean of the following 6 months and the mean of the
preceding 6, in units of the series' month-to-month spread, for UKV minus ERA5, UKV minus the
station, and ERA5 minus the station, raw and with each calendar month's mean removed. No threshold
was set before the series was seen, so the table is exploratory. Where a product's difference from
the station steps and UKV minus ERA5 does not, the step points at the station, as the 2021 steps do.
Bias removal pools across years, so a station-side step adds error to both products. Figure 10 draws
the raw series and carries the licence notice, because Figure 10 plots UKV-derived monthly means.
A UKV-CEDA history has practical costs
A UKV-CEDA training history would need other weather for 357 of 10,338 runs, and the page's XGBoost models were given the era. Of the runs, 9,981 are complete, 15 are partial, 82 are missing, and 260 (on 65 days) were not listed on CEDA when the stores were fetched and were not re-checked. Five months lose more than 25% of their hours and are dropped, and two more straddle a physics change. The main work would fill those months from another source, which makes a mixed-source history that this study did not test. The 6-hourly lead pattern means the error rises with lead and drops at each run boundary. A feature built over several hours, such as a lag or a rolling mean, inherits that pattern. A history from 2019 spans three physics eras, with 3, 67, and 8 scored months, so the main work would need an era column as the XGBoost models here had.
UKV-CEDA is closer than ERA5 at the stations at every lead, but not clearly better for power
UKV-CEDA was closer than ERA5 to the readings at the four stations at every lead from 0 to 5
hours, and the advantage shrank as the lead grew. The lead is the hours since the run started, and
UKV-CEDA here is the stitched hourly series from the freshest of the four runs per day (00, 06, 12,
and 18 UTC). The table below gives each product's error and the difference at each lead, for set A
(temperature and wind speed at the four stations) and set B (the power error of XGBoost models at
the wind and solar farms). The errors are each product's own mean absolute error. The "pooled" row
of each outcome is the planned contrast (P1 to P4), and every single-lead row and refit row is post
hoc. Every interval covers month-to-month weather, and the power intervals cover the fitting seed
too. A negative difference favours UKV-CEDA, and the power rows use the primary hyperparameter
setting. The table is printed by ukv_ceda_vs_era5_lead_summary.py into lead_summary.md, from the
saved intervals. The planned split of P2 by lead, P2-lead, is not in the table: UKV-CEDA minus ERA5
is -0.187 K [-0.198, -0.176] over leads 0 to 2 and -0.061 K [-0.075, -0.047] over leads 3 to 5.
| Outcome | Lead (hours since the run started) | Status | ERA5 error | UKV-CEDA error | UKV-CEDA minus ERA5 [95% interval] |
|---|---|---|---|---|---|
| Temperature (K) | pooled over leads 0 to 5 | planned | 0.711 | 0.587 | -0.124 [-0.135, -0.113] |
| Temperature (K) | 0 | post hoc | 0.715 | 0.465 | -0.250 [-0.263, -0.237] |
| Temperature (K) | 1 | post hoc | 0.706 | 0.527 | -0.179 [-0.192, -0.167] |
| Temperature (K) | 2 | post hoc | 0.702 | 0.572 | -0.131 [-0.144, -0.118] |
| Temperature (K) | 3 | post hoc | 0.715 | 0.618 | -0.097 [-0.111, -0.083] |
| Temperature (K) | 4 | post hoc | 0.711 | 0.660 | -0.050 [-0.065, -0.035] |
| Temperature (K) | 5 | post hoc | 0.718 | 0.682 | -0.035 [-0.050, -0.021] |
| Wind speed (m/s) | pooled over leads 0 to 5 | planned | 1.066 | 0.925 | -0.140 [-0.156, -0.125] |
| Wind speed (m/s) | 0 | post hoc | 1.068 | 0.855 | -0.213 [-0.231, -0.197] |
| Wind speed (m/s) | 1 | post hoc | 1.061 | 0.920 | -0.141 [-0.161, -0.123] |
| Wind speed (m/s) | 2 | post hoc | 1.067 | 0.932 | -0.135 [-0.151, -0.118] |
| Wind speed (m/s) | 3 | post hoc | 1.064 | 0.939 | -0.125 [-0.142, -0.108] |
| Wind speed (m/s) | 4 | post hoc | 1.066 | 0.944 | -0.122 [-0.141, -0.104] |
| Wind speed (m/s) | 5 | post hoc | 1.067 | 0.961 | -0.106 [-0.124, -0.088] |
| Wind power (% of capacity) | pooled over leads 0 to 5 | planned | 7.174 | 7.299 | +0.125 [+0.033, +0.216] |
| Wind power (% of capacity) | 0 | post hoc | 7.143 | 7.085 | -0.058 [-0.192, +0.070] |
| Wind power (% of capacity) | 1 | post hoc | 7.024 | 7.115 | +0.091 [-0.021, +0.202] |
| Wind power (% of capacity) | 2 | post hoc | 7.135 | 7.206 | +0.071 [-0.057, +0.185] |
| Wind power (% of capacity) | 3 | post hoc | 7.141 | 7.313 | +0.173 [+0.049, +0.288] |
| Wind power (% of capacity) | 4 | post hoc | 7.341 | 7.491 | +0.149 [+0.030, +0.270] |
| Wind power (% of capacity) | 5 | post hoc | 7.261 | 7.583 | +0.323 [+0.205, +0.437] |
| Wind power (% of capacity) | refit on lead 0 rows | post hoc | 7.224 | 7.158 | -0.065 [-0.203, +0.069] |
| Wind power (% of capacity) | refit on leads 0 to 1 rows | post hoc | 7.121 | 7.128 | +0.007 [-0.107, +0.117] |
| Solar power (% of capacity) | pooled over leads 0 to 5 | planned | 4.877 | 4.876 | -0.001 [-0.009, +0.004] |
| Solar power (% of capacity) | 0 | post hoc | 4.541 | 4.544 | +0.003 [-0.008, +0.016] |
| Solar power (% of capacity) | 1 | post hoc | 4.400 | 4.392 | -0.009 [-0.020, +0.002] |
| Solar power (% of capacity) | 2 | post hoc | 4.732 | 4.731 | -0.001 [-0.011, +0.009] |
| Solar power (% of capacity) | 3 | post hoc | 5.162 | 5.161 | -0.001 [-0.012, +0.008] |
| Solar power (% of capacity) | 4 | post hoc | 5.408 | 5.408 | -0.000 [-0.013, +0.012] |
| Solar power (% of capacity) | 5 | post hoc | 5.011 | 5.011 | -0.000 [-0.015, +0.012] |
| Solar power (% of capacity) | refit on lead 0 rows | post hoc | 4.676 | 4.669 | -0.007 [-0.017, +0.004] |
| Solar power (% of capacity) | refit on leads 0 to 1 rows | post hoc | 4.538 | 4.528 | -0.010 [-0.020, -0.001] |
At the stations, UKV-CEDA was closer at every lead, from -0.250 K at lead 0 to -0.035 K at lead 5 for temperature and from -0.213 m/s to -0.106 m/s for wind speed (both post hoc). ERA5's own error stays between 0.702 K and 0.718 K for temperature and between 1.061 m/s and 1.068 m/s for wind speed across the six leads, so the shrinking advantage comes from UKV-CEDA's error growing. UKV probably assimilates these four stations, although the page has not checked which stations UKV assimilates, so the stations are not independent of UKV. The advantage falling with lead fits assimilation and also fits forecast error growing from each run, and the page tests neither.
For wind power, UKV-CEDA was level with ERA5 at leads 0 to 2 and behind it at leads 3 to 5. For solar power, UKV-CEDA was level at every lead. No power row shows UKV-CEDA ahead by as much as a planned margin (post hoc). For wind power the difference is -0.058 points [-0.192, +0.070] at lead 0, and ERA5 is statistically significantly ahead at leads 3, 4, and 5, by +0.173, +0.149, and +0.323 points. The XGBoost models refitted on the lead-0 rows alone give -0.065 points [-0.203, +0.069], and on the lead 0 to 1 rows alone +0.007 points [-0.107, +0.117]. For solar power, no interval at any lead reaches further than 0.020 points from zero, and the refit on the lead 0 to 1 rows gives -0.010 points [-0.020, -0.001], which is statistically significant and inside the 0.06-point margin. The page does not claim that ERA5 beats UKV, because the XGBoost models given ERA5 and those given UKV-CEDA differ in the height and the served lead of their inputs as well as in the product.
Three scope limits apply to the table. Lead 0 covers only the 00, 06, 12, and 18 UTC hours, so the lead-0 rows score 4 hours of the day, and each lead pools different hours of the day. A solar hour's temperature averages the instants at both ends of the hour, so a solar lead-0 hour also reads the previous run's lead 5. The page does not decide what Flexpectation version 1 will use.
Two further questions: the first hours of each UKV run, and change over the years
The study answers two further questions, both post hoc. Question 1 is whether UKV-CEDA beats ERA5 when only UKV-CEDA's first leads are used, as if those leads were an analysis. Question 2 is whether the difference between UKV-CEDA and ERA5 changes over the years, as a change in UKV's physics would make the difference do.
Answer 1: at the four stations, UKV-CEDA's first leads are closer than ERA5 for temperature and wind speed, and the point estimates for power differ from ERA5's by less than the planned margins. At lead 0 UKV-CEDA minus ERA5 is -0.250 K [-0.263, -0.237] for temperature and -0.213 m/s [-0.231, -0.197] for wind speed. At leads 0 to 1 the differences are -0.214 K [-0.226, -0.204] and -0.177 m/s [-0.195, -0.161]. UKV probably assimilates those stations, although the page has not checked which stations UKV assimilates. For wind power, XGBoost models refitted on the lead-0 rows alone (24,359 farm-hours) give P3 -0.065 points [-0.203, +0.069], and on leads 0 to 1 (48,631 farm-hours) +0.007 [-0.107, +0.117]. At lead 0 the interval reaches about 0.2 points in UKV-CEDA's favour and at most 0.07 points in ERA5's. The lead-0 interval rules out an ERA5 advantage as large as the 0.16-point margin and does not rule out a UKV-CEDA advantage of that size. For solar power the refits give -0.007 points [-0.017, +0.004] at lead 0 and -0.010 [-0.020, -0.001] at leads 0 to 1. The refit on leads 0 to 1 is statistically significant and inside the 0.06-point margin. Lead 0 is 00, 06, 12, and 18 UTC, so the lead-0 rows score 4 hours of the day. The analysis-only refits ran at the primary setting only. A solar hour's temperature averages the instants at both ends of the hour, so a lead-0 solar row also reads the previous run's lead 5.
Answer 2: no UKV-CEDA minus ERA5 difference shows a trend over the years that the study can attribute to UKV. At the stations, the temperature difference has a slope of -0.004 K per year [-0.010, +0.002], and the wind-speed difference -0.012 m/s per year [-0.020, -0.005]. That wind interval treats months as independent. With resampled runs of 6 consecutive months the interval is [-0.019, +0.000], and with runs of 12 months [-0.015, +0.002]. By station, the wind slope is -0.026 m/s per year [-0.040, -0.011] at S3 and -0.004, -0.003, and -0.004 (none statistically significant) at S1, S2, and S4. One station carries the slope. A station-side change, such as the step the stations share around August 2021, fits as well as a change in UKV, so the page reads the wind slope as exploratory and fragile. For power, the P3 slope is -0.040 points per year [-0.088, +0.008]. Without the 8 months of 2026 the P3 slope is -0.020 [-0.082, +0.037], so half of the slope comes from 2026. The P4 slope is -0.000 [-0.003, +0.002]. By-year and by-era rows are in the temperature section, the wind-gap sections, and the 2026 section.
The three eras cannot separate a change of UKV from the season. The date of PS44 is unknown, and no step in UKV-CEDA minus ERA5 appears in the monthly series. Only three eras exist, era 0 holds 3 months, and era 2 holds 8 months, 6 of them in April to September. A line smooths a step, and every interval covers month-to-month weather only.
Discussion: what to use
For past wind, the planned rule gives ERA5, and the choice is between ERA5 and CEDA's 6-hourly UKV store, not between ERA5 and UKV. The XGBoost model given ERA5's wind has the lower error by 0.125 points, which is below the margin, so the gain from choosing ERA5 is small. The post hoc rows say that most of the gap sits at longer leads, in winter, and at one farm. Two kinds of evidence would change the recommendation: a UKV archive served at lead 0 with a hub-height wind (the past-wind page's Open-Meteo archive), or evidence from 2026 that the UKV of 2026-01-21 onwards is ahead, which era 2 hints at but does not establish.
For past temperature, the planned rule gives UKV-CEDA, on the evidence of four stations that are probably assimilated. UKV-CEDA's 1.5 m temperature is 0.124 K closer to the stations' readings than ERA5's 2 m temperature, and 0.035 K closer at lead 5. The page says nothing about temperature away from those stations, nothing about how UKV-CEDA's temperature helps a demand forecast, and nothing about how much of the advantage comes from the 2 km cell, which by itself matches a point observation better than a 25 km cell does. No forecast in the study improved by as much as a planned margin with UKV-CEDA's temperature: for solar power on the whole row set, the choice makes no difference above 0.009 points. The recommendation carries the costs in A UKV-CEDA history has practical costs and the licence below.
For training history from 2019, the early-years test passes for UKV-CEDA temperature. The test needs the early window's point estimate below zero and its upper bound below the margin: P2's early window is -0.108 K [-0.128, -0.088], with margin 0.035 K, which is 5% of ERA5's error on the early-window rows. Era 0 holds only 3 months, so the early window rests mostly on 2020.
The maintainer has to decide whether the main work's use of UKV-CEDA as training history is non-commercial. CEDA's catalogue record for the NWP-UKV data states the Creative Commons Attribution-NonCommercial-ShareAlike 4.0 licence. This page publishes error scores and charts and no UKV value, apart from Figure 10's monthly means, and cites the data as Met Office (2016): NWP-UKV: Met Office UK Atmospheric High Resolution Model data. Centre for Environmental Data Analysis, https://catalogue.ceda.ac.uk/uuid/f47bc62786394626b665e23b658d385f. Whether ShareAlike reaches adapted material is not settled here.
Limitations
- Four stations are few. The intervals cover month-to-month weather and the fitting seed, and do not cover differences between stations, between generators, or between places outside one box. The four stations and six solar farms share their weather.
- Set A scores the product at a point that UKV may have assimilated. The advantage falls with lead, and no result here says how large the advantage is away from the stations.
- A 2 km cell favours a point observation over a 25 km cell, by itself. Bias removal removes offsets from exposure and orography and not that advantage.
- Bias is removed in-sample and pooled across years and eras. Both products' errors are debiased by their own means, taken over all years including the scored row. The in-sample optimism is about equal for the two products. Era 0's older physics, if anything, penalises UKV-CEDA in the early window.
- The stations step together around August 2021. The step adds error to both products, and slightly more in relative terms to UKV-CEDA, the product with the smaller error.
- The wind contrast mixes product, height, and served lead, and a 2 km cell against a 25 km cell for the farms. The page claims no cause. CEDA's archive is not the hourly feed that Open-Meteo archives.
- ERA5 is read at the nearest 0.25 degree cell. The temperature comes from Open-Meteo's copy of the Copernicus archive, which disagrees with Copernicus on 12 days that the study drops.
- The significance statements cover month-to-month weather and the seed. Of the 221 exploratory and post hoc splits of the UKV-CEDA against ERA5 contrasts at the primary setting, 73 are statistically significant at the 5% level. Of the 73, 47 come from the matched 10 m pair, a further 10 are splits of the other contrasts by UTC hour, and 16 are other splits, so the 73 are not 73 independent findings. A split with no real effect has a nominal 5% chance of reaching the level, and the page does not correct for that. Separately, 16 of the 19 controls and replications are significant, as the controls section explains.
- The figures rest on the
effective_capacitytable at Delta version 1, read when the rows were built on 2026-10-06. Each generator's capacity is its 99th percentile of output from that table, so a rebuilt table would move every figure. - Some choices followed a look at results. The 5 dropped months were chosen after the
implementer had seen the set A tables.
verify.mdalready showed UKV-CEDA ahead on raw error at lag 0 for wind and temperature. The margins, the rule, and P2-lead were fixed in the plan earlier, and nothing in the code was tuned to those looks. - Departures from the plan. The 25% guard dropped 5 months; the re-check of the 65 unlisted days against CEDA was not done; a keep-zero-hours block covering all months was added; the wind row set is the intersection of the centred and hour-ending power targets; the search for PS44 was not repeated; and post hoc rows were added after the first results (each single lead and leave-one-station-out in set A, the lead, UTC-hour, published-window, and era splits of P3, the matched 10 m pair, the power-hour scan, the analysis-only refits, and the slopes per year with their block-bootstrap and per-station variants).
Scope
The study covers wind speed and air temperature at four stations, and power at three wind farms and six solar farms, in one box in Lincolnshire, from September 2019 to September 2026. The study does not score dew point, sea-level pressure, surface pressure, 500 hPa height, precipitation type, or windchill. The study does not test the hourly UKV feed that Open-Meteo archives, a UKV archive served at lead 0, UKV's 100 m or hub-height wind (the archive holds none), a wider crop, a demand forecast, or a mixed-source history. The study does not reopen the choice of CAMS for irradiance.
Data and code availability
The inputs are public except the generators' metered output, their coordinates, the capacity
table, and the station-to-farm mapping, which is withheld because the mapping would narrow where a
metered generator is. The public inputs are the CEDA archive of UKV runs (licence above), ERA5
from the Copernicus Climate Data Store and Open-Meteo's copy, CAMS irradiance, and the Met Office
MIDAS Open release dataset-version-202607. The generators appear only as W1 to W3 and A to F, and
the stations as S1 to S4 with no identifier or coordinate. The code that produced every figure is in
studies/past_weather/ and src/studies/, at the commit that merged this page. Every XGBoost
model used XGBoost 3.4.1, tree_method hist, the objective reg:absoluteerror, and four threads
per fit. The hyperparameter settings are studies.cross_validation.PRIMARY_HYPER_PARAMETERS and
SENSITIVITY_HYPER_PARAMETERS. The plan for this study is in the repository's git history.
Reproducing the figures
Run the commands below in order, after the stores, ERA5, CAMS, and MIDAS downloads are on disk.
--check-only runs the coverage check without reading a UKV value. Each script refuses to overwrite
an output, so a re-run first moves the earlier output to superseded/. The --verified command
writes intervals.parquet, report.md, and decision.md once. The --report-only command near
the end writes those three files again with the extra fits included, so the block moves the first
copies to superseded/ between the two commands.
uv run python studies/past_weather/ukv_ceda_vs_era5_build.py --check-only
uv run python studies/past_weather/ukv_ceda_vs_era5_build.py
uv run python studies/past_weather/ukv_ceda_vs_era5_verify.py
uv run python studies/past_weather/ukv_ceda_station_scores.py
uv run python studies/past_weather/ukv_ceda_vs_era5_fit.py --verified
uv run python studies/past_weather/ukv_ceda_vs_era5_build.py --matched-10m
uv run python studies/past_weather/ukv_ceda_vs_era5_fit.py --fit-matched
uv run python studies/past_weather/ukv_ceda_vs_era5_build.py --hour-starting
uv run python studies/past_weather/ukv_ceda_vs_era5_fit.py --fit-hour-starting
uv run python studies/past_weather/ukv_ceda_vs_era5_fit.py --fit-lead-restricted
D=data/studies/per_study/ukv_ceda_vs_era5
mkdir -p "$D/superseded" && mv "$D"/{intervals.parquet,report.md,decision.md} "$D/superseded/"
uv run python studies/past_weather/ukv_ceda_vs_era5_fit.py --report-only
uv run python studies/past_weather/ukv_ceda_vs_era5_lead_summary.py
uv run python studies/past_weather/ukv_ceda_vs_era5_charts.py
npx svgo@4 --multipass --precision=1 --final-newline docs/studies/assets/ukv_ceda_vs_era5/*.svg