Experiment 7: does a static CAMS correction remove the stage 1a daytime residual?
We asked whether the daytime error of a demand forecast comes from a fixed error in its estimate of sunlight, or from changes in how much embedded solar generation (solar panels connected to the distribution network, such as rooftop panels) is installed. We fitted a fixed correction, using the Copernicus Atmosphere Monitoring Service (CAMS) satellite-based estimate of sunlight as a second estimate, to one year of the forecast's errors. We then checked how much of the next year's daytime error the correction removed. The correction removed 46.6% of the squared daytime error, but a fixed bias alone removed 39.1% and one substation set the pooled figure, so the test could not separate the two explanations.
This is the cheap first test that decides whether to carry out the later steps of proposal P2 (the embedded-solar-capacity proposal) in the research plan. The result says whether the daytime residual of the stage 1a demand model tracks a fixed error in the ERA5 irradiance input (the sunlight estimate that stage 1a was trained on), or a change in embedded solar capacity that a correction with fixed coefficients cannot follow. The plan was committed before the code ran; the Results section reports the run. ERA5 is a reanalysis, an estimate of past weather. Stage 1a is an XGBoost model per series that turns weather into power. In the body below, "P2" also names one of the 13 substations.
Size
- What gets stored: residual tables and figures only, under this experiment's private folder. Nothing enters a Delta table.
- Production serving path: not touched.
- Degradation rule: not touched.
- Designs that would test the hypothesis defensibly: two. A linear correction of the residuals answers the question cheaply and is the planned design. Retraining the XGBoost model with CAMS as a feature is the later P4.
- Callers that need searching for: none, because the script reads 00006's stored predictions and the CAMS download from PR #1201 (Download and validate CAMS irradiance at the demand series' locations).
The experiment is medium: it uses a new data source and a new method, but touches nothing stored for production. It gets one Sonnet review of the plan, one of the code, and one of the write-up.
Design
The residuals come from 00006's out-of-fold fits. The residual is the metered power over
effective capacity minus the median forecast of the chosen arm, times 100, averaged over the three
seeds of the finals stage. Each validation year was forecast by a model trained on data ending
a week before that year starts, so no residual comes from a fit that saw its own row. The two
years are 2024-07 to 2025-06 (year A, fold select_2024) and 2025-07 to 2026-06 (year B, fold
confirm_2025). Half-hours are averaged to the hour ending at the CAMS time stamp, as in
e00006_solar_residual.py, and only daylight hours (solar zenith below 80 degrees) are kept.
The correction is fitted on year A and scored on year B, per substation. Each correction is an ordinary least-squares fit of the hourly residual on the columns below, with its coefficients frozen after year A. Scoring on year B is the walk-forward test of a static correction. The substations are the Primary series that have CAMS values (14 planned; one has no year A rows, so 13 are scored).
| Arm | Fitted columns | Role |
|---|---|---|
none |
nothing | The uncorrected forecast |
shift |
intercept | A fixed daylight bias |
era5 |
intercept, ERA5 shortwave | What stage 1a could already learn |
cams |
intercept, CAMS irradiance | CAMS alone |
era5+cams |
intercept, ERA5 shortwave, CAMS irradiance | The headline arm |
cams-era5 |
intercept, CAMS minus ERA5 shortwave | One coefficient on the difference |
Two planned contrasts, both on year B. The first is the share of the daylight mean squared
residual removed by era5+cams against none. The second is the partial R squared of CAMS given
ERA5, that is 1 - SSE(era5+cams) / SSE(era5). A third quantity, the mean absolute error of the
median, is read for the same arms because it is the metric the other experiments report. The
stability ratio is the out-of-sample share removed divided by the share removed when the same
correction is fitted on year B itself. A ratio near 1 means the relation is stable. A low ratio
means the coefficients drift between the years.
The interval resamples whole months, each with all 13 scored substations. Weather is shared across substations and hours within a day, so the block is a month of year B with every substation in it. The 98.33% interval (Bonferroni across the three interval conditions) comes from 10,000 resamples of the 12 months, rescored from the frozen coefficients. With 12 blocks the tails are coarse, and the write-up says so. The write-up also reports the share removed for each substation, and the share removed with each substation left out in turn. The script does not run the leave-one-month-out repeat that an earlier draft of the plan mentioned.
The stability ratio is pooled. Its numerator is the out-of-sample share removed and its denominator is the share removed by the same correction fitted on year B. A denominator below 5% makes the ratio undefined, and the outcome is then inconclusive.
| Share removed | Stability ratio | Outcome |
|---|---|---|
| 50% or more | 0.8 or more | P4 gate, if the three interval conditions also hold |
| 50% or more | 0.5 to 0.8 | Inconclusive |
| 20% to 50% | 0.5 or more | Inconclusive |
| 20% or less, or any share | below 0.5 | P2 capacity-change statistics |
CAMS is a lag-time input only. CAMS is observed after the fact and has no forecast, so a stage 1a trained on it could use it only for the past. Its latency at forecast time is not checked here. A positive gate is a necessary condition for P4 and does not show that the input is available in time. ERA5 arrives about 5 days late, so the ERA5 column is also a lag-time input in this test.
Year B's residuals come from a model trained on year A. The confirm_2025 model saw year A, so
it may already have absorbed part of a fixed ERA5 error, and the stability ratio then measures that
model change as much as any drift. Year B is also 00006's confirmation fold, and the July 2025
exploration in e00006_solar_residual.py has already looked at one month of it. The arm and the
seeds of the chosen forecast were selected on folds that include year A. The write-up repeats all
three points. The expected sign of the CAMS coefficient is negative, as at P12 in that exploration.
CAMS and ERA5 shortwave are collinear, so the write-up reports the partial R squared and not the
two coefficients. A linear fit on irradiance cannot capture a response that is nonlinear in cloud,
so a low share removed is weaker evidence than a high one.
Confounds the write-up has to discuss. A fixed error in ERA5's cloud field and a fixed embedded-solar capacity both give a static relation, so a positive gate says the relation is stable over one year and does not exclude capacity. The stability ratio is the only evidence against capacity drift in this test.
Results
The gate does not open for P4, and does not close for P2: the outcome is inconclusive. The planned share removed was 50% or more. The result is 46.6%, with a 98.33% month-block interval of 38.4% to 53.1% that straddles 50%. The stability ratio is 0.84, so the relation held across the two years. A fixed irradiance error gives a stable relation, and a steady capacity gives one too. The plan's table calls a share of 20% to 50% with a ratio of 0.5 or more "inconclusive". Seven conditions held: the partial R squared is above zero, the MAE gain against the shift is at least 0.3 points (0.73), and the stability ratio is at least 0.8. The lower bound of the share's interval is above 25% (38.4%). One condition failed: the share removed is below 50%.
| Arm | Share of daylight squared residual removed | Daylight MAE of the median (points of capacity) |
|---|---|---|
| Uncorrected | 0% | 8.78 |
| Fixed daylight shift | 39.1% | 7.52 |
| ERA5 shortwave | 40.0% | 7.41 |
| CAMS | 42.7% | 7.11 |
| ERA5 and CAMS | 46.6% | 6.80 |
| CAMS minus ERA5 (one coefficient) | not scored | 7.00 |
The out-of-sample figures use 13 Primary substations, not the 14 planned. One substation has no 2024-07 to 2025-06 residual, so it has nothing to fit on. Fitting each correction on the scored year gives 55.8%, from which the stability ratio of 0.84 follows.
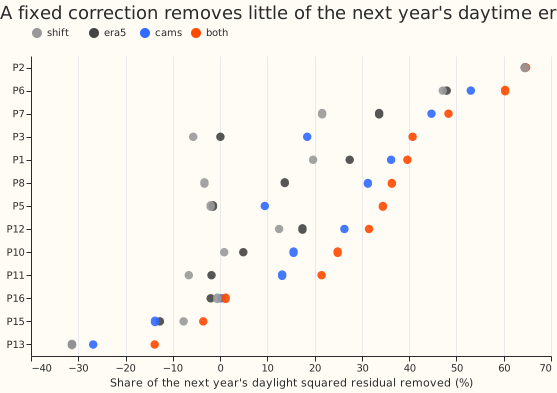
Most of what the correction removes is a fixed daytime bias, and one substation sets the pooled figure. The shift arm alone removes 39.1%, so CAMS adds 7.5 percentage points of share on top. Substation P2 has a mean absolute error of 34.1 points before correction, against a median of 5.8 at the other substations, and its shift alone removes 64.5%. Without P2 the pooled share is 18.2%, and an 18.2% share would sit in the plan's P2-capacity branch. The median substation's share is 34.4%. The correction makes the next year worse at 2 of the 13 substations (P13 and P15), removes almost nothing at P16 (1.2%), and has its largest partial R squared at P3 (0.41).
What this means for the follow-up work. CAMS carries information that ERA5 shortwave lacks at all 13 substations (partial R squared above zero), so a CAMS-trained stage 1a (P4) is worth a test of its own, with the substation that sets the pooled figure treated separately. The result does not show that the residual is an irradiance error and not a change in capacity. A growing capacity and a fixed ERA5 cloud error both give a stable relation, and the model behind year B was trained on year A, so it may have absorbed part of the error. The slope statistics of P2 should wait for that follow-up.
Caveats. The 98.33% interval resamples 12 months, so its tails are coarse. The MAE is of the hourly mean residual in daylight hours, not of half-hours. Year B is 00006's confirmation fold, and the earlier July 2025 exploration had already looked at part of it. CAMS has no forecast and its latency at forecast time was not checked.
Script: ml-experiments/00007-cams-static-correction-stage1a-residual/e00007_correction.py.