Does the full best-guess demand stack, with the D5 solar clip and the gap rule added, beat BG2 and the manual heuristic over one scored year, and where does it lose?
The full best-guess demand forecast has a lower error than BG2 and the manual heuristic over 2025-07-02 to 2026-06-30, but its gain comes from winter, and at substation D5 on sunny half-hours it is still clearly worse than BG2. BG2 is an XGBoost forecast configured like the production service, with the settings that scored best in experiment 87. The manual heuristic is the rule NGED uses today. D5, D9, D10, D11, D14, and D16 are anonymised primary substations, which feed homes and businesses. We took the forecast of experiment 220 (arm 1). Arm D is the convex demand model with a Kalman filter. Arm 1 is arm D plus a small neural network that corrects its median (the neural-network head) and a mean-and-standard-deviation summary of the 51 ensemble weather members' solar response. We called arm 1 "the stack". We then added the 60% solar clip at D5 from experiment 180. The clip caps the modelled solar output that the forecast subtracts from demand at 60% of the solar capacity held for D5. We scored every forecast on the same 561,207 rows from 2025-07-02 to 2026-06-30. A row is one forecast of one substation's half-hour from one forecast run, at one lead time. A quantile score (also our CRPS, the continuous ranked probability score) is twice the mean pinball loss over 11 quantiles (q01, q05, q10, q25, q40, q50, q60, q75, q90, q95, q99), in points, meaning percentage points of the substation's effective capacity (its rated demand). Lower is better.
The clip arms are an approximation, because we added the clip's per-row shift in the mean forecast to stored forecasts instead of refitting them. That shift includes the clip's effect on the filter state and the fit, so it is non-zero at night as well as at midday, and the solar summary and the network head were built on the unclipped solar term. Arm 2 adds the clip's per-row shift in the mean forecast, measured on arm D alone, to every quantile of arm 1 at D5. Arm 2b adds it to the stack without the head, and arm 2c (post hoc) uses arm 2b at D5 and arm 1 at the other five substations. Experiment 237 scored the solar summary with the clip applied inside the member pass. The coast-and-widen rule of experiment 205 changes only rows after a reading gap, so on the scored year's rows arm 3 equals arm 2 and the rule is reported from experiment 205's injected gaps.
Verdict supported. The gate passed on the five decision substations. Arm A scored 2.7524
against the required 2.7519 ± 0.005, BG2 2.7809 against 2.780 ± 0.005, and arm 1 2.6167 against
2.617 ± 0.005. Arm 1 is the pre-registered winner, because arm 2 was 0.038 points worse than arm 1
on D5 sunny daylight (interval -0.169 to +0.274), not 0.05 points better. It beats BG2 on the
six-substation quantile score by 0.136 points (95% interval -0.277 to -0.005). It also beats the
manual heuristic on all four headline metrics. The upper bound of the BG2 interval is only 0.005
below zero, so the margin is thin.
Results
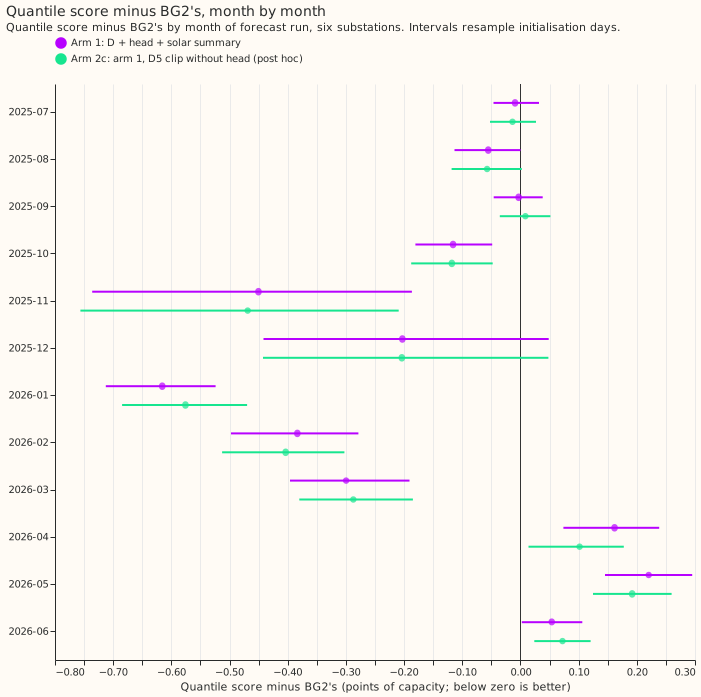
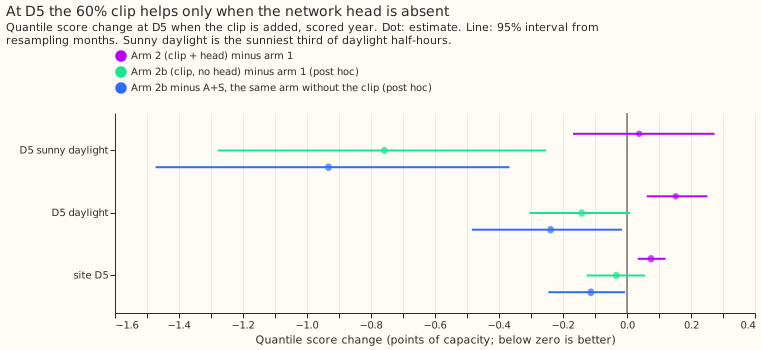
- Prediction scorecard. P1 held (-0.136, in the predicted 0.10 to 0.17). P2 held: arm 2 equals arm 1 at the other five substations, and at D5 it is worse than arm 1 on sunny daylight (+0.038, -0.169 to +0.274) and on all D5 rows (+0.075, +0.034 to +0.121). P3 held: arm 2b's D5 sunny-daylight median error is 0.103 MW below arm 1's (0.033 to 0.170 MW). P4 held: the heuristic clause on all four metrics, and arm 1 is worse than BG2 in April, May, and June (+0.162, +0.220, +0.054), three of the six months from April to September. P5 held as stated, and see the gap bullet.
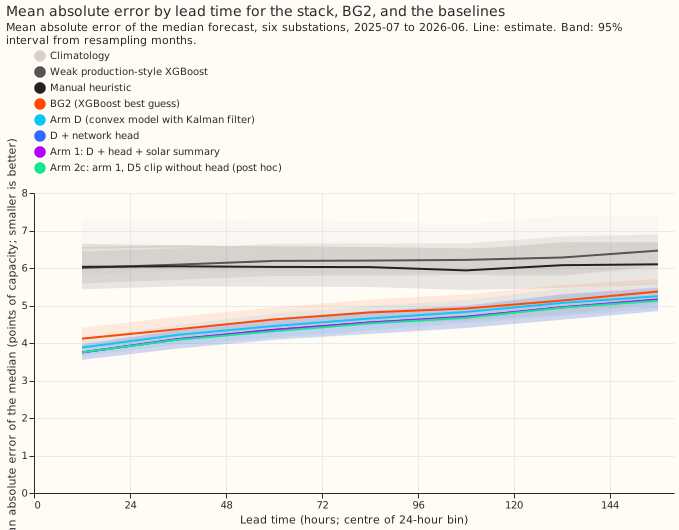
- Absolute scores, six substations (quantile score; mean absolute error of the median; tail-weighted CRPS at the 95th and 99th percentile of earlier power): arm 1 2.579; 4.510; 0.171; 0.044. Arm 2c 2.574; 4.490; 0.171; 0.044. BG2 2.715; 4.767; 0.202; 0.051. Manual heuristic 3.397; 6.034; 0.246; 0.059. Climatology 3.665; 6.558; 0.263; 0.063. Weak XGBoost 5.697; 6.206; 0.360; 0.075. Arm D alone 2.688; 4.623; 0.191; 0.053. Arm D with the head 2.611; 4.510; 0.171; 0.044.
- Arm 1 minus BG2 (95% intervals, six substations): quantile score -0.136 (-0.277 to -0.005), mean absolute error -0.257 (-0.492 to -0.009), tail-weighted CRPS at the 95th percentile -0.032 (-0.073 to -0.004), at the 99th -0.008 (-0.019 to -0.001). It wins 9 of 12 months. All six substations have a negative estimate (D14 -0.266, D16 -0.227, D11 -0.176, D10 -0.108, D5 -0.031, D9 -0.004), but only the D14 and D16 intervals exclude zero (D11's reaches +0.001).
- Arm 1 minus the manual heuristic: quantile score -0.818 (-1.080 to -0.574), mean absolute error -1.524 (-2.027 to -1.079), tail-weighted CRPS at the 95th percentile -0.076 (-0.143 to -0.021), at the 99th -0.016 (-0.031 to -0.004), and 12 of 12 months. Arm 2c differs from arm 1 by under 0.02 on every one of these.
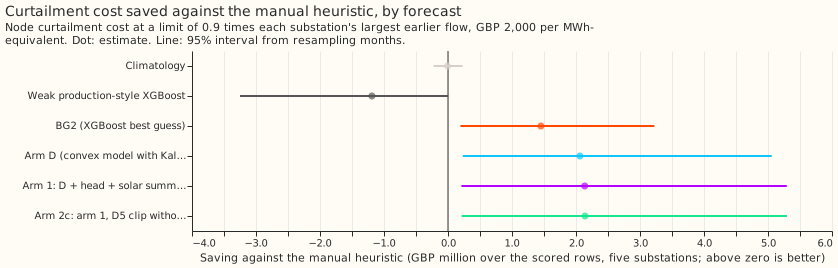
- Curtailment saving against the manual heuristic (GBP over the scored rows, five substations, limit 0.9 times the largest earlier flow, GBP 2,000 per MWh-equivalent; 95% interval): arm 1 2.14 million (0.21 to 5.29 million), arm 2c 2.14 million (0.21 to 5.30 million), arm D 2.06 million, BG2 1.45 million (0.19 to 3.23 million), climatology -0.01 million, weak XGBoost -1.19 million. At limits of 0.75 and 0.5 the order is the same: arm 1 11.1 and 30.1 million, BG2 7.1 and 21.9 million. The heuristic's implied risk level and the price are the assumptions of experiment 228; the intervals are wide.
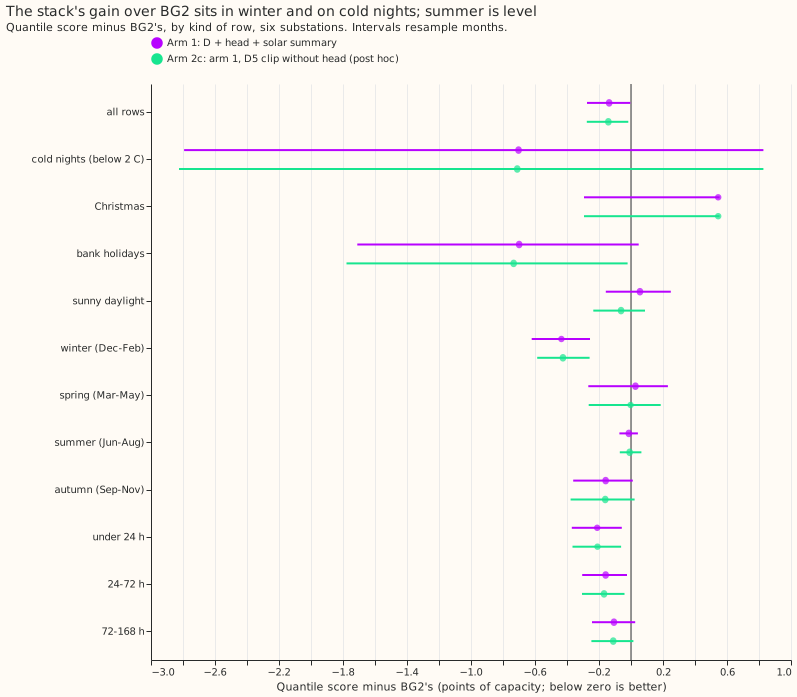
- Where it loses to BG2 (arm 2c minus BG2, quantile score): D5 sunny daylight +0.540 (0.331 to 0.743); arm 1 there is +1.298. Christmas +0.545 (-0.293 to +0.554) on the blocks of two months (December 2025 and January 2026), so the interval is not informative. April to June are positive for arm 1 (+0.054 to +0.220). Winter is -0.425 (-0.586 to -0.259), 12 to 36 hours ahead -0.192, and daylight -0.200.
- Cold nights below 2 C and bank holidays (arm 2c minus BG2): cold nights -0.711 (-2.825 to +0.828), over 3 months; bank holidays -0.734 (-1.778 to -0.021). On cold nights the q95 coverage is 0.965 for arm 2c, 0.781 for BG2, and 0.538 for the manual heuristic.
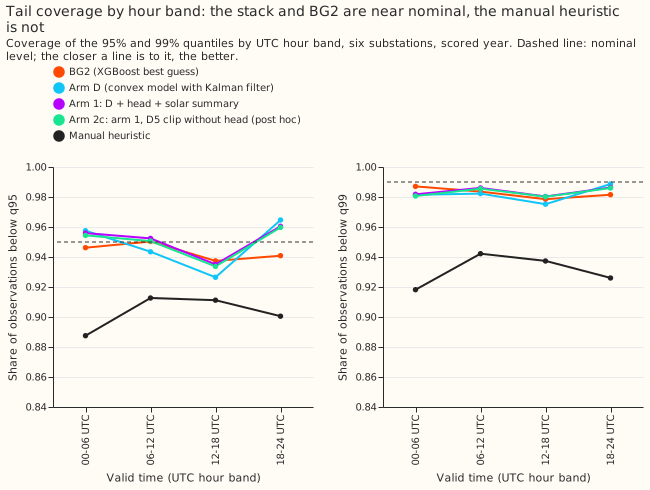
- Tails, six substations (coverage; pinball loss, arm 2c against BG2): q01 0.013; 0.172 against 0.010; 0.211. q05 0.048; 0.621 against 0.041; 0.623. q95 0.950; 0.696 against 0.944; 0.751. q99 0.983; 0.213 against 0.983; 0.253. By UTC hour band the q95 coverage of arm 1 runs from 0.935 (12-18) to 0.960 (18-24), and q99 from 0.980 to 0.986.
- D5 clip, quantile score change on D5 sunny daylight (95% interval): arm 2 minus arm 1 +0.038 (-0.169 to +0.274); arm 2b minus arm 1 -0.758 (-1.279 to -0.253); arm 2b minus the same arm without the clip -0.933 (-1.473 to -0.367), or 0.124 MW of median error (0.050 to 0.193 MW). Over all D5 rows arm 2b minus arm 1 is -0.034 (-0.126 to +0.057). D5 tail coverage changes by under 0.01 at every quantile for all three clip arms.
- Gap rule, from experiment 205's stored scores (arm D on injected gaps, quantile score): gaps of 3, 6, 24, and 72 hours score 2.759, 2.788, 2.857, and 2.948 with coasting and widened bands, against 2.747 with no gap and 3.198 for the frozen model alone, so coasting is 0.25 to 0.44 below the frozen model alone. At 72 hours coasting without widening (2.953) and with it (2.948) are not better than the frozen model with its offset and recipe R (2.940). We did not measure the share of scored rows that follow a natural reading gap.
- Weak production-style XGBoost model (experiment 87's
ref_xgboost_baseline): its median error (6.206) sits level with the manual heuristic's (6.034), but its q01 to q99 band is 2.6 points wide against BG2's 36.6, and its q01 and q95 coverages are 0.41 and 0.52. Its quantile score of 5.697 reflects bands that are far too narrow, so only its median error compares fairly. - Rows and schedule: experiment 228's rows (561,207 across six substations, 09:00 UTC runs, leads 0.5 to 168 hours, outside hand-filtered load shifts). Experiments 220, 228, and 87 stored every forecast; nothing was refitted in this experiment. The stack's monthly refits and BG2's weekly refits are those experiments' schedules. Weather at lag times is the ensemble weather available at forecast time. No downloads.
- Post hoc: arm 2b, arm 2c, and the weak XGBoost comparison; every cut other than the planned D5 sunny-daylight rows.
- What to try next: the solar term at D5 on sunny hours; a retrained head on clipped residuals, which would replace the shift approximation; and A second scored year would need BG2 to be rerun for earlier months.
Checks
- Median minus mean forecast, arm 1, per substation (points; the mean is arm D's, before the head's correction): D5 +0.014, D9 -0.746, D10 +0.721, D11 -0.496, D14 -0.200, D16 -0.843. The head moves the median by under 1 point of capacity.
- Mean-forecast error beside the quantile-score contrasts: the median's absolute error and the quantile score move the same way in every contrast against BG2 and the manual heuristic, so trigger 3 did not fire. For arm 1 the mean's absolute error is 5.31, 4.21, 3.69, 4.48, 6.01, and 4.21 at D10, D11, D14, D16, D5, and D9, against 5.36, 4.20, 3.53, 4.03, 5.83, and 4.25 for the median.
- Triggers (the seven audit triggers of the experiment guide): the failed control (1), the median-versus-mean disagreement (3), and the interval-width mismatch (6) did not fire; the gate passed and the contrasts agree in sign. Trigger 4 fired in part: leaving one substation out keeps arm 1 minus BG2 negative every time (-0.110 to -0.164), but the 95% interval then spans zero when D11, D14, or D16 is left out, so the gain over BG2 depends on all six substations and its upper bound is only -0.005. A fresh Sonnet agent re-derived the headline contrasts from the stored arrays with its own code and found no difference above 0.005 points. Trigger 5 fired: arm 1, which contains no clip, beats arm 2 at D5 (+0.075, +0.034 to +0.121). Experiment 232 predicted that, and arm 2b tests the explanation. Trigger 2 did not fire, because the plan's P2 predicted that result. Trigger 7 is open: later work depends on the winter gain, which one year of data supports.