Does mixing the ECMWF ensemble's members with the AIFS ensemble's members and with climatology, weighted by lead, lower the wind forecast's quantile score and tail score, once an offset table corrects the common low bias?
Take-home: the AIFS ensemble improves the wind forecast's quantile score at 3 to 6 days ahead, but
neither it nor climatology nor a neural gate improves the high-power tail. We asked whether the
wind forecast for three metered farms (W1 to W3) improves when the 51 ECMWF ensemble members are
pooled with the 51 members of the AIFS ensemble (a machine-learning weather model from ECMWF,
available from Dynamical.org under CC BY 4.0), with climatology (the
typical power for the month and half-hour), or both. Every member runs through the ERA5-trained
XGBoost model of experiment 230, and every arm
then gets the table of offsets of experiment
259, which corrects the common low bias.
We scored October 2025 to June 2026 on the rows kept by experiment 210's idle-row mask. The
verdict is partly supported: the AIFS result passes the decision rule's point threshold but its
interval ends 0.003 points of capacity short, and the other two contrasts fail.
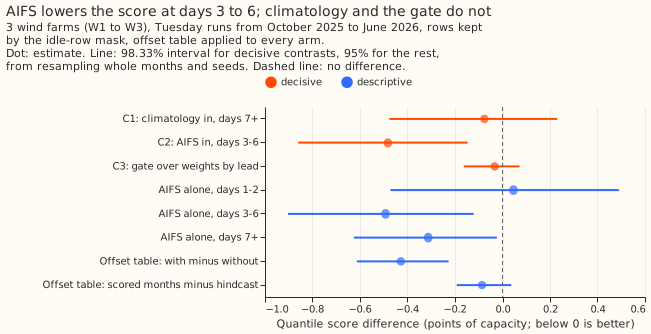
AIFS lowers the quantile score at days 3 to 6 by 0.48 points of capacity. The 98.33% interval is -0.86 to -0.147 (C2); the threshold needed an interval wholly below -0.15. The 0.99 pinball loss at days 3 to 6 is not lower (0.567 against 0.563 for M0), so the prediction of a 3% fall missed. The gain also exceeds the predicted -0.10 to -0.30. At days 0 to 2 the prediction was ±0.05, and the estimate was -0.12 (-0.45 to +0.14). Climatology's days 0 to 2 contrast (+0.01, -0.01 to +0.03) stayed inside its predicted ±0.02.
Climatology and the neural gate add nothing. Climatology weights by lead day lower the score at days 7 and later by 0.08 (-0.48 to +0.23, C1), against a predicted -0.15 to -0.40. Without the offset table the same arm lowers it by 0.45 (-0.89 to -0.09, D10), slightly more than the predicted range. The offset table therefore removes most of the long-lead gain that climatology gave, which tests the explanation for the miss. The gate changes the score by -0.03 (-0.16 to +0.07, C3) against the weights by lead day, just outside the predicted ±0.03. The gate that reads only the lead (M5b) scores within 0.01 of the full gate (D1).
Design and results
- Arms. Each arm has a version without and one with the offset table ("+T"). M0: the ECMWF members. M1q and M1p: M0 with climatology, by quantile averaging and by linear pool, one weight per lead day. M2: the AIFS members alone. M3: the linear pool of the ECMWF and AIFS members, one weight per lead day. M4: M3 with climatology. M5: a neural gate (one hidden layer of 16 units) that reads the lead, each ensemble's standard deviation of 100 m wind speed, and the difference of the two mean speeds. M5b: the same gate reading only the lead. M3prev: M3 with the AIFS run of 18 UTC the day before. C1 is M1q+T minus M0+T at days 7 and later, C2 is M3+T minus M0+T at days 3 to 6, and C3 is M5+T minus M4+T over all leads. D1 to D10 are descriptive contrasts of other arms, named where they appear; their intervals are at 95%, and the intervals of C1 to C3 are at 98.33%.
- Rows. The rows are 53 Tuesday runs from 2025-07-01 to 2026-06-30 at W1 to W3 (107,121 cases). The first run has no AIFS run, so 52 runs (105,016 cases, 1.9% of runs missing) remain. July to September 2025 train the weights, spread factors, and tables; October 2025 to June 2026 are scored: 71,294 kept rows per seed, 213,882 over three seeds. Intervals resample whole months and seeds 50,000 times; the farms are not resampled.
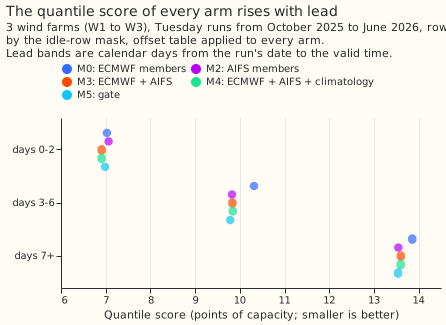
- Scores, kept rows, with the offset table (points of capacity: days 0 to 2 / 3 to 6 / 7+ / all). M0 7.03 / 10.32 / 13.86 / 11.63. M1q 7.04 / 10.33 / 13.78 / 11.60. M2 (AIFS alone) 7.06 / 9.82 / 13.54 / 11.34. M3 6.91 / 9.83 / 13.60 / 11.34. M4 6.91 / 9.84 / 13.60 / 11.34. M5 6.99 / 9.79 / 13.54 / 11.31. M5b 6.99 / 9.87 / 13.49 / 11.31. M2 matches M3 within 0.15 points of capacity at every band. Most of the gain therefore comes from using the AIFS members instead of the ECMWF members, not from pooling the two.
- Tail, kept rows, all leads (T: mean of the 0.01 and 0.99 pinball losses; then the 0.99 pinball loss). M0 0.451, 0.601. M1q 0.456, 0.612. M2 0.464, 0.630. M3 0.459, 0.618. M4 0.464, 0.629. M5 0.475, 0.644. No arm lowers either; AIFS raises the 0.99 pinball loss (M3 minus M0 +0.017). The curtailment use case therefore gets no gain from these arms.
- Calibration, kept rows, all leads. Coverage of the 5% to 95% band is 92.3% to 92.8% for every arm (nominal 90%), and of the 1% to 99% band 97.5% to 97.9% (nominal 98%). The share of rows below the median is 45.3% for M0 and 46.7% for M3.
- The offset table lowers the score, and AIFS removes part of the low bias on its own. Without the table M0 scores 12.06 and M3 11.58, a difference of -0.49 (-0.60 to -0.38, D7). The table lowers M0 by 0.43 (-0.61 to -0.23, D5). The hindcast table of experiment 259 scores 11.72 on M0, and the table fitted on the scored months beats it by 0.09 (-0.19 to +0.04, D6).
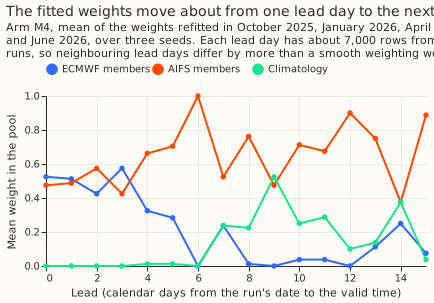
- The fitted weights are noisy. M4's mean weight on AIFS (over the weights refitted in four months and three seeds) is about 0.5 at days 0 to 3, 0.66 to 0.70 at days 4 and 5, and 0.68 to 0.90 at days 10 to 13 (figure 3). Climatology gets weight (0.2 to 0.5) only at days 7 to 11 and day 14. Lead days 6 and 12 give AIFS weight 1.0 and 0.9. Each lead day has about 7,000 cases in the 53 runs, and a month's weights use only the earlier cases, so neighbouring days jump about. The gate's mean weights (0.27 ECMWF, 0.58 AIFS, 0.15 climatology) are smoother.
- The linear pool is no better than quantile averaging. The linear pool M1p scores 0.03 worse than quantile averaging M1q (0.01 to 0.05, D3), and 0.06 worse at days 7 and later (0.03 to 0.09). On the tail score it does not beat quantile averaging (+0.01, -0.003 to +0.03 at days 7 and later).
- The gate gives nothing over weights by lead. M5 beats M5b by 0.00 (-0.06 to +0.08, D1), so reading the spread and disagreement of the two ensembles gives nothing over reading the lead. At days 0 to 2 the gate's tail score is 0.072 worse than M4's (0.044 to 0.100). The gate minimises the continuous ranked probability score, which weights the tails little, which may explain the loss; we did not test this.
- AIFS alone against ECMWF alone. M2 minus M0 is +0.05 at days 1 to 2 (-0.47 to +0.49), -0.49 at days 3 to 6 (-0.90 to -0.12), and -0.31 at days 7 and later (-0.63 to -0.02; D4). The prediction that AIFS alone scores worse at days 0 to 2 could not be tested at this width.
- Run timing and AIFS version. Reading the AIFS run of 18 UTC the day before (M3prev) scores 0.09 worse than the 00 UTC run on the same rows (-0.01 to +0.20, D9), so the gain does not depend on the assumed 09:00 UTC availability. Before the AIFS version change of 2026-05-12, M3 scores 0.33 below M0 (12.13 against 12.46, kept rows, with table); from that date, 0.09 below (7.44 against 7.53). The later period has 8 runs, so the smaller gain is descriptive.
- Stop rules. AIFS alone (M2) scores better than climatology at days 1 to 6, so no AIFS arm stopped.
Checks
- Audit triggers. A result contradicting its prediction fired for C1, and the session tested the explanation (D10, above). The same trigger fired for C2's size, for which no explanation was tested, and for C3's tail result (the untested explanation above). A nested arm losing to the arm it contains fired mildly for the gate. The other triggers did not fire: no control failed, the median-error contrast was not computed, three farms are too few for a leave-one-out check, and no sister experiment has the same contrast. No Opus audit ran, and the maintainer may want one before a port.
- Code review. One Sonnet review found no look-ahead leakage. It found that the pool read the ECMWF members by a different interpolation than M1q did, so M1q now reads them the same way; the scores moved by under 0.01. It also found, and we did not fix, three small effects: the weight statistics subsample each ensemble to 49 of 199 levels (so they see slightly less tail spread than the pool applied), arms with zero-weight sources add interpolation nodes in the pool, and the July to September rows are not spread before the first table is fitted. The three seeds differ only through the XGBoost boosters, since the gate's output layer starts at zero.
- Circularity. The weights are fitted on the continuous ranked probability score before the spread factor and the offset table are, so the tables see forecasts the weights never saw. The alternative (fit the weights through the table) was not tried.
- Scope. Three farms and 53 Tuesday runs; intervals describe these farms and months.
What the next experiment should answer
Whether AIFS still lowers the quantile score at days 3 to 6 on a second year of runs, and whether weights by lead band (days 0 to 2, 3 to 6, 7 and later) hold up better than weights by lead day.