Are the false steps in the meter-regime test load shifts between Primaries?
The false steps in experiment 207 are not load moved between connected Primary substations, and the load-shift alarms do not explain them. A Primary substation is one that feeds homes and businesses. Experiment 207 fitted one solar capacity (in MW) for each month to a Primary's power. In a year with no change at the site, the fit still jumped by more than 0.5 MW between two months at some Primaries. We call such a jump a false step. Experiment 207's test requires fewer than 1 false step per year, and the test failed at the anonymised Primaries D10 and D11.
We asked whether the false steps are real transfers of load between neighbouring Primaries, which would also show as a step in the Primary's demand forecast error. We took the 7 false steps at D10 and D11 that fall between two summer months, so that the month of the step is known. For each, we looked for an explanation within a 30-day window around the month boundary. An explanation is either a step of the opposite sign at a metered neighbouring Primary, 0.4 to 2.5 times the size of the Primary's own largest step and at least 2 noise units (a noise unit is the spread of that Primary's one-day steps in odd-numbered months), within 6 hours of the own step; or an alarm within 24 hours of the own step from one of three load-shift alarms. The alarms are RO-NC (the refit-offset neighbour-count detector of experiment 130), the pair alarm (opposite steps at a connected metered neighbour, experiment 156), and the learned score (a logistic regression on the detector features, experiment 195).
We repeated the check on random 30-day windows at the same Primary and calendar month, with a step of similar size and no false step within 31 days. These matched windows give the base rate: how often an explanation appears when no false step is present. This experiment reads stored results and fits nothing. The result narrows the search: the false steps and the load-shift detectors are separate problems, and the first check at the false steps is the cleaning rule's zero readings.
The prediction fails: 3 of 7 false steps have an explanation (0.43), below the matched base rate
of 0.66, where the prediction needed at least twice that rate. The 95% interval for the ratio is
0.19 to 1.0 (bootstrap over the 7 false steps). No false step has a balanced opposite neighbour
step (0 of 7, base rate 0.51). Verdict not supported.
The recount of experiment 207's test shows nothing about cause. With the explained false steps removed, the test passes at D10 (0.80 false steps per year, from 1.73) and still fails at D11 (1.00). Matched random windows are explained more often (0.66) than the false steps are (0.43), so removing "explained" steps removes steps at random. This is a diagnostic, and the verdict on experiment 207 stands as it was.
Checks
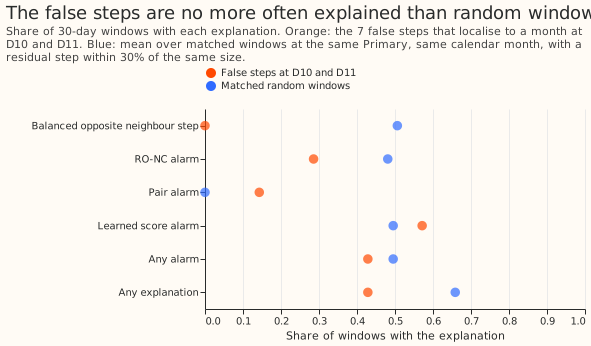
The false steps are explained no more often than matched windows, whichever explanation is counted. Each row gives the share of the 7 false steps, then the base rate in brackets:
- Balanced opposite neighbour step: 0 of 7 (0.00; 0.51).
- RO-NC alarm: 2 of 7 (0.29; 0.48).
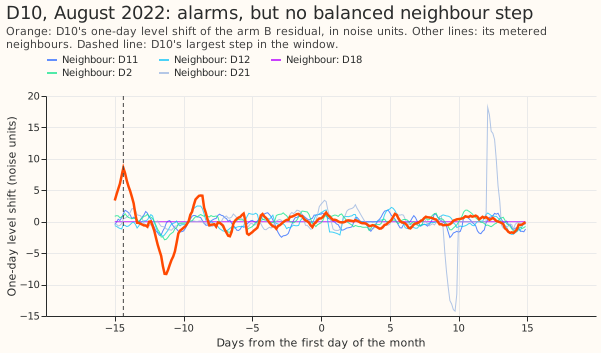
- Pair alarm: 1 of 7 (0.14; 0.00). The one pair alarm is at D11, August 2022, where no matched window had one, so one event decides this row.
- Learned score alarm: 4 of 7 (0.57; 0.50).
- Any alarm: 3 of 7 (0.43; 0.50).
- Any explanation: 3 of 7 (0.43; 0.66).
An explanation counts only where the Primary's largest residual step in the window reaches 3 noise units. At D11, August 2022, the step is 2.7 noise units, so its pair and learned alarms are not counted. Counting them would give 4 of 7 explained (0.57), still under the base rate of 0.66.
The ratio to the base rate is 0.65 (0.19 to 1.0) at D10 and D11 together. It is 0.75 at D10 alone (5 false steps) and 0.00 at D11 alone (2 false steps). Across the four Primaries that have matched windows, the ratio is 0.71 (0.26 to 1.0) for 8 of the 10 false steps; D14 has no matched window. An alarm anywhere in the 30-day window occurs at 4 of 7 false steps (0.57), against 0.55 of matched windows.
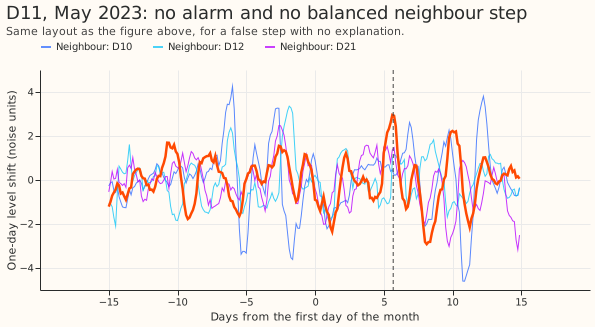
Three false steps sit within a day of readings of 0 MW that the cleaning rule flags, and no
matched window does. These are D11 August 2022, D11 May 2023, and D14 August 2022, each with 1 to
7 half-hourly readings flagged substation_zero, against none of the 241 matched windows. The
model sees a flagged zero as an ordinary reading, so the zeros may cause the step; this experiment
does not test that. No false step is within a day of a bank holiday (share of matched windows:
0.11). The largest residual step has the same sign as the capacity step in 4 of the 10 false steps
and the opposite sign in 6, so the two steps do not share a direction.
No audit trigger of the ml-experiment skill fired. The failed prediction was pre-registered as
a possible outcome. No control or nested arm exists. D10 alone and D11 alone give the same verdict
(0.60 against 0.80 at D10, 0.00 against 0.30 at D11, observed share against base rate). No later
experiment depends on the result. No forecast is scored, so the forecast-error checks do not apply.
Notes
- Row definition: the false steps are the step path of experiment 207 at weight 0.3 (its pre-registered penalty on month-to-month jumps), fitted with no injected farm, on summer rows of 2022 to 2024. Experiment 207 fitted 5 row sets per Primary, one for each solar farm it injected in other tests, and the same step in several row sets counts once. A false step between two summer months is dated to a 30-day window centred on the first day of the later month, because the fit gives one capacity per month, so a step can be dated only to a month.
- Gate recount: false steps per year before and after removing the explained ones: D5 0.00 and 0.00, D10 1.73 and 0.80, D11 1.00 and 1.00, D14 0.93 and 0.67, D16 0.60 and 0.27. The August-to-April net change makes up 10 of D10's 26 false-step counts and 5 of D11's 15, where a count is a false step in one row set in one year, and the recount keeps it because it cannot be dated. A post hoc recount without it, before any removal, gives D10 1.07 and D11 0.67.
- The Primary's own step: the largest one-day level shift of the demand model's forecast error in the window, from the convex model of experiment 130 (arm B), needing 3 noise units. The step of D10 in August 2022 falls at the window's edge (Figure 2), so a window of this width can pick a step from the neighbouring month.
- Alarms: RO-NC from experiment 130, and the pair alarm and the logistic learned score from experiment 195. The learned score counts an alarm from any of experiment 195's three cross-validation folds, so it covers more alarms than one fold would.
- Matched windows: 241 windows over the 8 false steps that have any (10 to 62 per false step; both D14 false steps have none and drop out of the ratios). The size match is on the Primary's own largest residual step in MW, within 30% of the false step's, not on the size of the capacity step. The windows come from 2022 to 2025 (16, 10, 85, and 130 windows in each year in turn). The alarm tables cover every year to mid-2026.
- Caveats: 7 false steps at the two failing Primaries cannot show a small effect, and the ratio's interval is 0.19 to 1.0. A capacity fitted once per month cannot show cause. The residual uses ERA5 past weather, not forecasts, and the alarm tables are built with hindsight, so the check favours the detectors more than live use would.
What the next experiment could answer
One option is whether the 3 readings flagged substation_zero beside false steps cause the steps.
A fit that masks flagged zero readings, and keeps the August-to-April net change out of the
false-step count, would show how many of the 26 and 15 false-step counts remain at D10 and D11.