Differentiable physics: can a more flexible temperature curve in the convex model carry the network's correction?
Adding extra terms for very hot and very cold weather to arm D, our convex demand forecast,
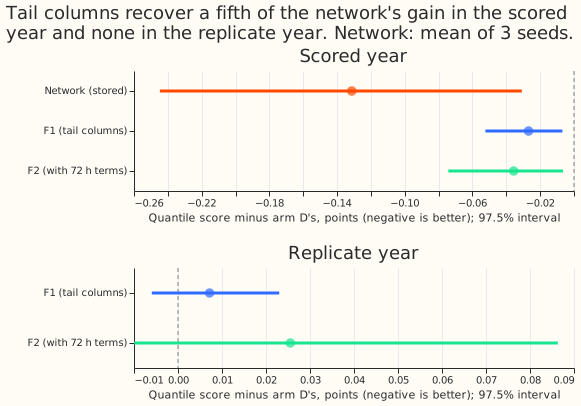
recovered 20% to 27% of the quantile-score gain that a neural network gives over arm D in the
scored year, and the recovery was not confirmed in a second year. The neural network's correction
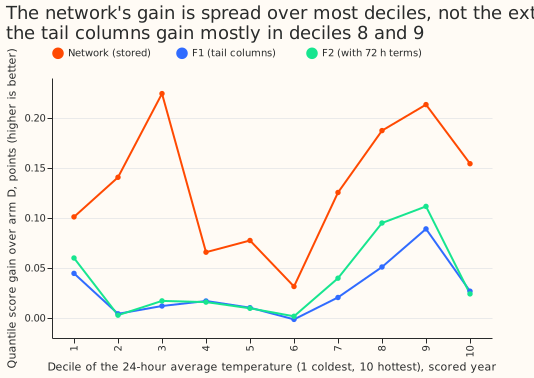
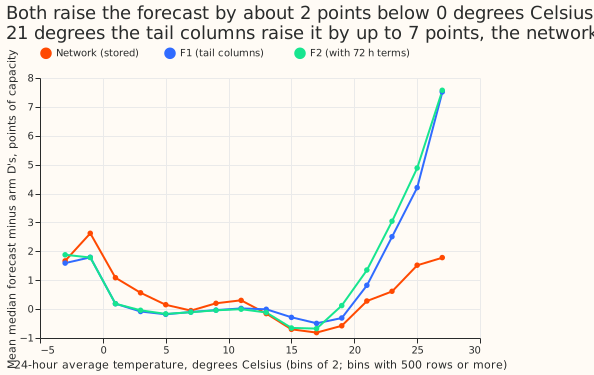
is spread over all temperatures instead of sitting at the extremes, and a smooth function of
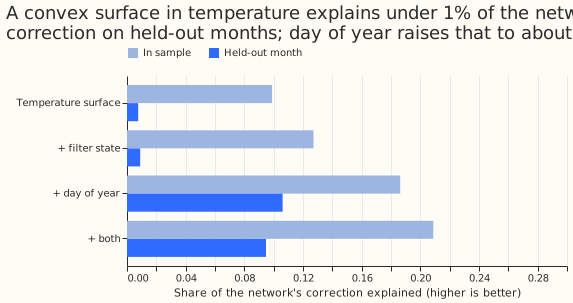
temperature explains under 1% of it. The neural network therefore uses an input other than
temperature. Calendar and seasonal inputs are where the remaining gain may lie. Under the
pre-registered rule, prediction 1 is partly supported at both the 0.05 and the 0.02 threshold: both
arms gain 0.027 to 0.036 points in the scored year, and neither gains in the replicate year. The
verdict is inconclusive because the placebo check of the pre-registered known-answer test failed
(10.2% in sample and 12.5% on held-out months, against a limit of under 10%); the shortfall against
the neural network does not depend on that check.
This experiment asked whether the correction that a small neural network gives the best-guess convex demand forecast (arm D of experiment 155) is a shape the convex model could carry. Experiments 200 and 201 found that the network lowers the quantile score by 0.09 to 0.125 points, and experiment 209 found that a binned table recovers only 0.035 to 0.041. We refitted the convex model with extra hinge terms in the hot and cold tails of each substation's temperature range, rebuilt arm D from the refits, and compared the result with the stored network on the same rows. We then fitted a convex surface to the neural network's correction. The fit shows how much of the correction a function of temperature, hour band, and day type can express. A hinge term is zero below a given temperature and rises linearly above it. "Points" below are points of the quantile score, in percentage points of effective capacity. The scored year is 2025-07-02 to 2026-06-29, and the replicate year is the even months of 2024-07 to 2025-06.
Results
- Arms. R0 is arm D as stored; the rebuilt control reproduces it exactly (2.7562 points in the scored year, all 464,363 rows). F1 adds 32 tail hinge columns per substation (cold knots at the 5th and 1st percentiles and hot knots at the 95th and 99th percentiles of the training rows' 6-hour and 24-hour averaged temperature). F2 adds the same on the 72-hour average plus an unconstrained linear term in it (20 more columns). The stored network is arm 2 of experiment 201, three seeds.
- Schedule and rows. Monthly refit on 24 months, as in experiment 155; six substations, with the five decision substations (D5, D10, D11, D14, D16) in the contrasts. A weekly refit might change the contrast, because the tail knots move at each cut.
- Prediction 1 (convex route recovers half of the neural network's gain): failed. Under the pre-registered rule it is partly supported, because the scored-year intervals are wholly below zero but the gain is under 0.05 and the replicate year disagrees; the same holds at 0.02. In the scored year F1 scored 2.7293 (-0.027 against R0; 97.5% interval -0.052 to -0.007) and F2 2.7205 (-0.036; -0.074 to -0.007). The network scored 2.6197, 2.6153, and 2.6396 across seeds (-0.137, -0.141, -0.117 against R0), so F1 recovers 20% and F2 27% of the mean gain. In the replicate year (the even months of 2024-07 to 2025-06; the network is not stored there, so the comparison is with R0 only) F1 was +0.007 (-0.006 to +0.023) and F2 +0.026 (-0.010 to +0.086), with intervals that include zero. D10 alone drives this: without D10 F1 is -0.017 and F2 -0.016, and four of five decision substations improve with F1. Under 6 hours F1 gains in the replicate year (-0.027) and over 6 hours it does not, the reverse of the scored year. The decision rule's median monthly difference was not computed.
- Prediction 2 (convex surface explains 70% of the correction): failed. Temperature by hour band by day type explains 9.9% of the variance of the neural network's median correction in sample and 0.8% on held-out months (leave-one-month-out; 0.06% to 0.8% across three smoothing weights). Adding arm D's filter state gives 0.9%, day of year 10.6%, and both 9.5%. Held-out rows inside the other months' temperature range are 99.97% of the rows, so the low score is not an extrapolation artefact.
- Prediction 3 (gain sits in the outer deciles): failed. Deciles 1 and 10 hold 24.8% of the network's gain (95% interval 11.0% to 49.3%), 28.2% of F1's (-33.7% to 64.7%) and 23.0% of F2's, against 23.5% of the rows and 22.3% of arm D's score. The network's gain peaks in deciles 3, 8, and 9.
- Tuning. The tail ridge ratio was chosen on the tuning months from {1, 0.1, 0.01}. The mean absolute error of the filtered mean forecast on outer-decile rows was 4.591, 4.680, and 4.721 against 4.602 for arm D, so the base ridge (ratio 1) was chosen and the weaker penalties the brief asked for lost.
- Where F1 gains. The scored-year gain is at leads of 6 hours or more (-0.028; -0.054 to -0.007); under 6 hours the gain is -0.001 (-0.021 to +0.021). The gain is -0.015 to -0.035 at every substation, and no leave-one-out flips it (-0.025 to -0.030).
- Tail calibration (five decision substations, scored year; coverage and pinball loss):
| Arm | q01 | q05 | q95 | q99 |
|---|---|---|---|---|
| R0 | 2.4%, 0.215 | 7.0%, 0.712 | 94.7%, 0.749 | 98.3%, 0.232 |
| F1 | 2.3%, 0.213 | 6.9%, 0.706 | 94.9%, 0.745 | 98.4%, 0.232 |
| F2 | 2.3%, 0.213 | 6.8%, 0.704 | 95.1%, 0.741 | 98.4%, 0.231 |
Known-answer test and placebo check
- Known-answer test (hot-tail step). With 3% of the training window's mean absolute demand added to the target above the 95th percentile of temperature, F1 recovered 62% (F2 66%, arm D 20%) on the injected rows and 55% (58%, 21%) on held-out months, at every one of the 6 substations (59% to 66%). A ramp injection was recovered 68% and 66% against 11%; a cold-tail step 65% and 66% against 45%.
- Placebo. An injection in the middle half of the temperature range changed F1's fitted values on hot-tail rows by 10.2% of the amount in sample and 12.5% on held-out months (15% at D5, D10, and D11); F2 changed them by -0.8% and arm D by 23.7% in sample. F1 therefore fails the pre-registered limit of under 10%. Arm D leaks more than F1, so the leak is the smoothness of the convex demand model and not the tail columns. The verdict follows the pre-registered cap.
Consistency checks
- Median minus mean forecast, per substation: 0.000 at all six, because the stored quantiles centre on the corrected mean.
- Error of the mean forecast beside each contrast: F1 -0.053 (97.5% interval -0.108 to -0.012) and F2 -0.069 (-0.149 to -0.011) in the scored year, the same direction as the quantile score; in the replicate year +0.011 and +0.038, both with intervals that include zero.
- Triggers fired: trigger 4. In the replicate year F1's contrast is -0.017 without D10 and +0.009 to +0.019 without any other substation, because D10 alone is +0.107. Trigger 1 (a control fails: the placebo) and trigger 7 (the series of neural-network experiments depends on the headline) are also arguable. Audit trigger 4 fired and no audit was run, because of the quota. The verdict is inconclusive and nothing is ported on it. Read the replicate-year F1 contrast as unreliable: it flips sign when D10 is left out.
Caveats
- The replicate year has 6 resampling units (the even months), and the network is not stored there, so prediction 1's replicate clause compares the tail columns with arm D only.
- Deciles use the analysis-frame 24-hour temperature at the valid time, not the ensemble-mean temperature. The share of scored rows on which each tail hinge is active under the ensemble-mean weather was not computed.
- Arm S's leave-one-month-out folds are by the month of the run's origin, and a run's valid times reach up to 7 days into the next month, so the held-out score may be slightly inflated. The in-range share (99.97%) is measured against the global temperature range, not per hour band and day type, so it does not prove that no cell was extrapolated. Both faults would strengthen the conclusion only if the true score were higher, and the reported score is already under 1%.
- The pre-registered hypothesis range of 0.09 to 0.125 points came from experiment 201's six-substation figures; on the five decision substations the neural network's gain is 0.117 to 0.141.
- Only day of year was tested among the calendar inputs; lagged errors and holiday flags were not, so which inputs the neural network adds is not settled.
- The hot-hinge gain by hour band is mixed: F1 gains 0.10 in the night band and 0.05 at midday but loses 0.04 in the evening band on hot rows, so some of the hot-tail gain may be solar error.
What to try next
- Test calendar and seasonal inputs. Day of year takes a convex surface from 0.8% to 10.6% of the neural network's correction on held-out months, about a tenth of it, which may point at a seasonal or calendar effect that arm D's heating terms do not carry. A learned small network on day of year and hour, with the convex model as the comparison arm, is the ranked suggestion; it could fail if the gain vanishes in the replicate year.
- If hot-tail terms are tried again, cap the hot slope or test a stronger ridge.