Differentiable physics: can a boosted-tree calibrator capture the gain of the network without error inputs?
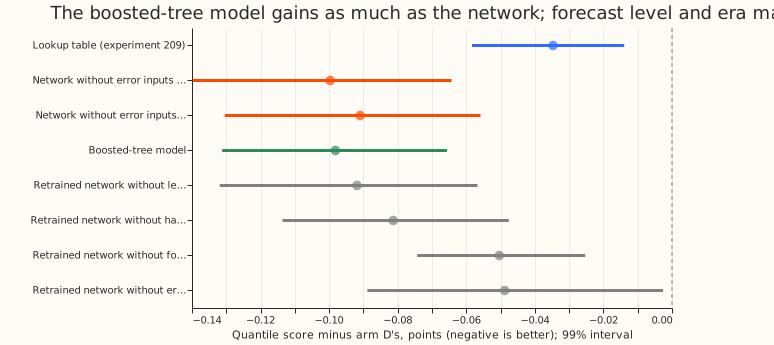
Take-home: a boosted-tree model captured 0.064 of the 0.065 points that lookup tables missed, so a boosted-tree calibrator is a candidate to replace the neural network, though the interval allows a loss of up to 0.026 points. Arm D is our best day-ahead demand forecast, from experiment 155. In experiment 200 a neural network that was given no recent forecast errors (the "network without error inputs") lowered arm D's score by 0.10 points. Experiment 209 showed that no lookup table gets beyond 0.041. We asked whether a gradient-boosted tree model gets the full 0.10 points without a neural network on the serving path, and which input of the neural network carries the gain.
Answer: yes by the rule fixed before the run, and forecast level and weather era carry the gain.
All scores are quantile scores in points of effective capacity, where lower is better. On the five
decision substations in 2025-07-02 to 2026-06-29, the boosted-tree model scores 0.098 points below
arm D, and 0.0015 points above the network without error inputs (99% interval over resampled months
-0.028 to +0.026). The point estimate is within the 0.02 limit and the interval includes zero, so the
verdict is supported. The interval is also wide enough to include a loss of 0.026 points, above
the limit, so the data do not show that the tree model is as good as the network, only that they
could not separate the two.
Results
- Setup. Rows, training window (2020 to 2025-06-27), validation block, and scored rows are those of experiment 200. The boosted-tree model is XGBoost with the pinball loss (Koenker and Bassett (1978)) at the 11 quantiles, fitted to arm D's quantile residuals on the network's inputs: substation, lead, half-hour, weekday, arm D's forecast level, the ensemble-era flag, and four of arm D's quantile offsets. Column subsampling is off, so that every arm sees every input. Depth 6, learning rate 0.1, minimum child weight 50, early stopping at round 288 on the validation block. The retrained network and its four ablations ran on CPU, with one seed each.
- Scores (five decision substations, points; lower is better). Arm D 2.432, lookup table (T0) 2.397, network without error inputs (stored, experiment 200) 2.332, the same network retrained here 2.341, boosted-tree model 2.334.
- Decision contrast. Boosted-tree model minus stored network +0.0015 (-0.028 to +0.026). Minus the retrained network -0.0072 (-0.036 to +0.018). Minus table T0 -0.064 (-0.085 to -0.044). Minus arm D -0.098 (-0.131 to -0.065).
- Ablations (each minus the retrained network, 99% intervals). No lead -0.0009 (-0.0049 to +0.0030). No half-hour +0.0097 (-0.0031 to +0.0253). No forecast level +0.041 (+0.021 to +0.065). No era flag +0.042 (+0.021 to +0.065). The retrained network gains 0.091 over arm D, so removing the forecast level or the era flag gives back 45% and 46% of the gain.
- Retrained against stored network. The retrained network scores 0.0087 above the stored one (+0.005 to +0.012), from a different seed and a CPU run. The ablation contrasts use the retrained network as the reference for this reason.
- Tails (boosted-tree model). Coverage at q95 95.0% and at q99 99.3%. Pinball at q99 0.373 and at q01 0.338 against T0's 0.385 and 0.352. Coverage at q05 and q01 was not computed.
- Leave one substation out. Boosted-tree minus retrained network stays between -0.015 and -0.002 when any one decision substation is dropped.
- All six substations. The decision contrast is +0.0038 (-0.023 to +0.029); no ablation contrast changes by more than 0.005.
- Pre-registered predictions. Boosted tree within 0.02 of the network: held. Removing forecast level or era removes at least half the gain: the point estimates (45% and 46%) fall just under half, and the intervals include half. Removing lead or half-hour changes the score by under 0.02: held.
- Caveats. One seed for each network arm. The tree model has no ablations of its own, so the experiment does not show that the tree model relies on the same two inputs. The 99% interval rests on about 12 resampled months and five substations.
Checks
- Median minus mean forecast per site and the error of the median forecast were not computed: the stored rows hold quantile scores only.
- Triggers fired: none. The result agrees with the pre-registered prediction, except that the two largest ablations removed 45% and 46% of the gain, just under the predicted half. No input was changed to make it hold, and the rows are those audited in experiment 200.
- Row alignment: arm D's losses agree with experiment 200's stored rows within 0.001, and the table T0 rows are those of experiment 209.
What to try next
- Fit the boosted-tree model on all 16 Primary substations and a second scored year, to narrow the interval that currently allows a 0.026 loss.
- Ablate the tree model's inputs, to check that it relies on forecast level and era as the network does.