Experiment 184: does the ensemble help calibrate the bands in daylight?
Running each of the 51 ensemble members through the solar part of the demand model improves the daylight bands by about 2%, and two placebos show the gain is information about cloud. The demand forecast's bands are quantiles of its error: the q05 is the value that the reading should fall under on 5% of half-hours. We asked whether the disagreement between the 51 members of the ECMWF ensemble about cloud helps those bands in daylight, where cloud changes demand through embedded solar generation. Experiment 169 had found no gain from the ensemble spread over all half-hours. We scored daylight (the sun 5 degrees or more above the horizon) and night separately, on the forecast that experiment 169 called arm A. One arm passed each member's irradiance through the solar term and left every other input at the ensemble mean. It lowered the daylight quantile score from 3.632 to 3.551 points in the scored year (-2.2%). Night is unchanged because the arms only change daylight rows. Scores are in points of effective capacity (percentage points of each substation's rated demand), lower is better.
- Method of the member arms. The fitted model is linear in its coefficients, so member m's forecast is arm A's mean plus the response of experiment 136's T-all fit to the member's unit PV shape minus its response to the ensemble mean's unit PV shape. Arm A's 11 quantile offsets from its mean, times one factor per calibration lead band (fitted on the tuning months), go around each member, and the 51 members are pooled as in experiment 111. The fitted factors are 0.95, 0.90, 0.90, and 0.85 for leads of 0 to 24, 24 to 48, 48 to 144, and 144 to 168 hours: the member spread supplies part of the width that arm A's offsets supplied.
- Arms. A: reference. M: members through the solar term. Mc: M with the responses centred on
zero. F: members through every weather input. S: arm A's daylight offsets times a scale fitted
by linear programmes on three spread statistics of the members' clear-sky index (standard
deviation, range, and
4 p (1 - p)for the share p of members at 0.8 or more). MR (placebo): arm A's offsets times a factor per lead band, no members. MP (placebo): M with each row's 51 responses taken from a random row of the same substation, calendar month, and hour band. SP (placebo): S's coefficients on statistics from such a row. K (the filter's observation variance) was not run, because it needs a refit of the filter's residual stream, outside the stored data. - Row set.
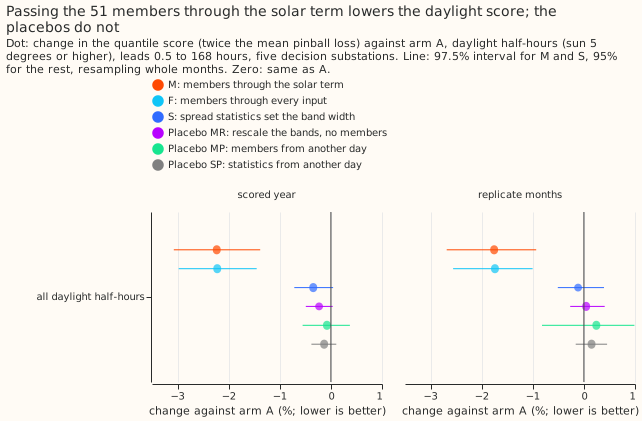
fold_a_daily_gap_v1, D5, D10, D11, D14, and D16 (D9 beside them, in no contrast), leads 0.5 to 168 hours, outside the hand-filtered switching events. Scored year 2025-07-02 to 2026-06-29: 464,363 rows, 211,576 in daylight, 225,774 at night, 27,013 in twilight (0 to 5 degrees, scored and unchanged). Mean forecasts are experiment 155's monthly refits, so no contrast depends on the retraining schedule. Ensemble weather is the stored 51-member forecast of experiment 111, available at forecast time; the weather source at lag times is the filter's, as in arm A. - Headline, C1 and C2 (daylight, change from arm A). M: -2.23% (97.5% interval -3.07% to -1.38%) in the scored year, -1.76% (-2.68% to -0.93%) in the replicate months. S: -0.34% (-0.72% to +0.04%) and -0.11% (-0.51% to +0.39%). Arm M meets every part of the pre-registered rule in both periods. Arm S does not.
- Controls. MR -0.23% (-0.49% to +0.03%), MP -0.08% (-0.55% to +0.37%), SP -0.13% (-0.38% to +0.11%) in the scored year; replicate months +0.04%, +0.24%, +0.15%. Mc -1.99% (-2.76% to -1.30%). F -2.22% (-2.98% to -1.45%), the same as M, so temperature spread adds nothing in daylight.
- Absolute scores, scored year (quantile score). Daylight: A 3.632, M 3.551, F 3.552, S 3.620, MR 3.624, MP 3.630. Night, all arms 1.981. All rows: A 2.752, M 2.715, S 2.746. Replicate months, daylight: A 3.453, M 3.393, S 3.449.
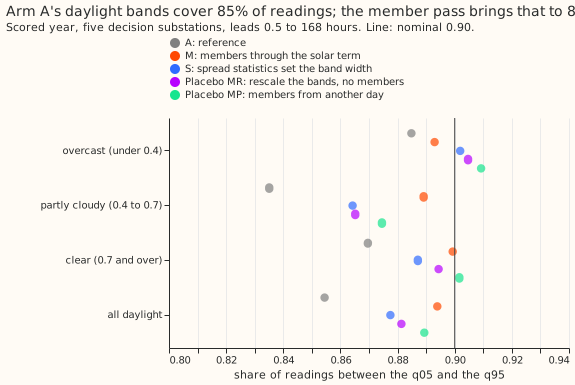
- Calibration, daylight, scored year. The q05-to-q95 coverage (nominal 0.90) is 0.854 for A, 0.894 for M, 0.877 for S, 0.881 for MR, and 0.889 for MP. Coverage alone cannot separate M from the placebos, which is why the scores matter. The mean q05-to-q95 width is 24.6 points for A and 26.8 for M.
- Tails, daylight, scored year (coverage / pinball loss). A: q01 0.027 / 0.265, q05 0.078 / 0.907, q95 0.933 / 0.924, q99 0.979 / 0.262. M: 0.013 / 0.230, 0.053 / 0.837, 0.947 / 0.880, 0.986 / 0.243. S: 0.021 / 0.251, 0.069 / 0.889, 0.946 / 0.920, 0.987 / 0.253. Most of the gain is in the lower tail, where high irradiance from some members lowers demand.
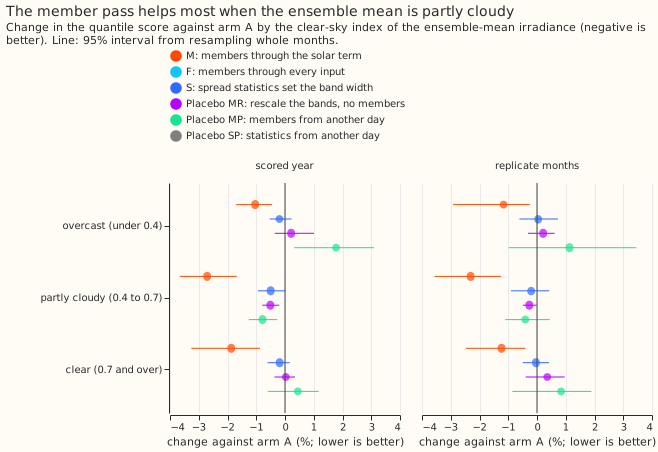
- By clear-sky index band of the ensemble-mean irradiance (M, scored year). Overcast (under 0.4, 18,210 rows) -1.04% (-1.69% to -0.46%); partly cloudy (0.4 to 0.7, 100,922 rows) -2.71% (-3.66% to -1.68%); clear (0.7 and over, 92,444 rows) -1.87% (-3.26% to -0.87%).
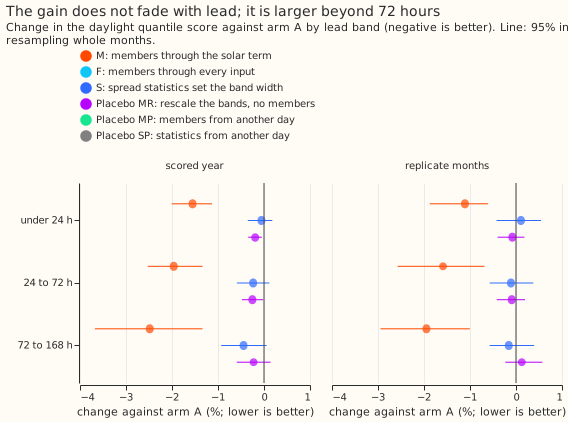
- By lead band (M, scored year). Under 24 hours -1.55% (-2.01% to -1.13%); 24 to 72 hours -1.96% (-2.53% to -1.34%); 72 to 168 hours -2.48% (-3.68% to -1.34%); 12 to 36 hours -1.82% (-2.35% to -1.19%). The prediction that the gain sits under 72 hours was wrong.
- By substation (M, scored year). D5 -3.15% (-4.41% to -1.83%); without D5 -1.89% (-2.66% to -1.13%); D10 -1.30%, D11 -1.09%, D14 -1.73%, D16 -3.42%. The five-substation result holds without D5 and without any one substation. In the replicate months D11's interval includes zero (-0.65%, -1.92% to +0.91%).
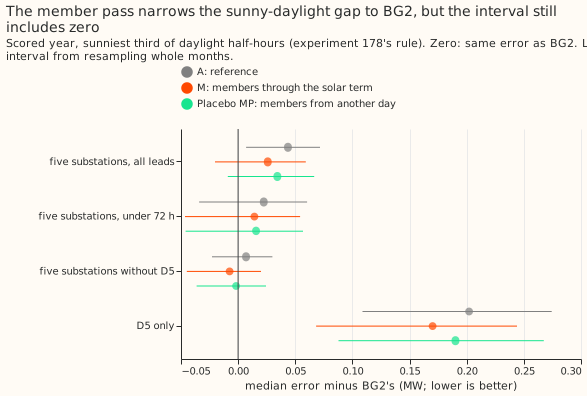
- Sunniest third (experiment 178's rule). M -4.85% (-7.67% to -2.92%) in the scored year; MP -1.77% (-3.74% to -0.47%). The gap to BG2 in the absolute error of the median, over 74,728 sunny half-hours at the five substations: arm A +0.044 MW, reproducing experiment 178's +0.044 MW (the interval 0.007 to 0.072); M +0.026 MW (interval includes zero, -0.020 to +0.059); MP +0.034 MW. Without D5: A +0.007, M -0.0075 MW. At D5: A +0.202, M +0.170 MW. D5 holds most of what remains.
- Checks. Median minus mean forecast per substation at 12 to 36 hours: exactly 0.000 for A and
S, and -0.14 (D5), -0.05, -0.05, -0.05, and -0.05 points (D10, D11, D14, D16) for M, because the
members' skewed responses pull the mixture median below the mean. The mean forecast's own daylight
error changes by -0.13% (-0.45% to +0.27%) for M, the same direction as the score. The reproduction
control G1 rebuilds experiment 136's mean to 5e-6 points on every row of all three periods.
Experiment 178's gap for arm A is reproduced. Gates. G2 passes: the unit PV shape built from
CAMS irradiance equals the cached shape (slope 1.000, largest gap 0) at all six substations. G3
fails its monotonicity criterion: member responses fall with the multiplier on 1,036 of 1,058
daylight rows (22 rows, 2.1%, fail) of the fake ensemble (a post hoc subset: 868 of 884 where the
fake clear-sky index stays at or under 1.1). The failing rows examined (five of them) are at
elevations of 14 to 16 degrees, where the unit PV shape from
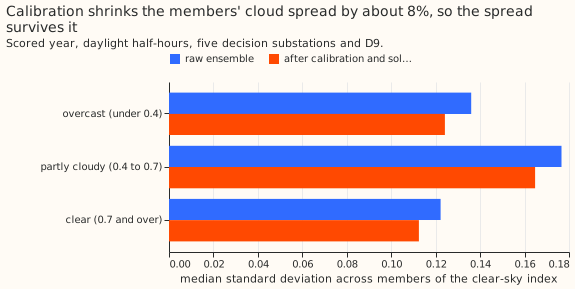
SunGeometry.pv_shape_and_ghiitself falls as irradiance rises (0.099, 0.124, then 0.090 as irradiance rises from 97 to 227 W/m2 at one half-hour), so the cause lies in the existing shape function. The wiring checks of G3 pass exactly: the response of the multiplier-1 member is zero, responses at night are zero, and the fake ensemble's spread statistic equals the known multiplier spread. The pre-registered rule caps the verdict atinconclusiveon a failed gate, so the verdict isinconclusive, and every other part of the rule is met by arm M in both periods. M restricted to elevations of 17 degrees and over scores -2.47% (-3.57% to -1.44%), so the result does not depend on those rows. G4: the members' median clear-sky-index spread is 0.122 raw and 0.112 after calibration in clear conditions, 0.177 and 0.165 when partly cloudy, 0.136 and 0.124 when overcast: calibration shrinks the spread by about 8%, so a null could not be blamed on it. - Audit (fresh Opus, one). Findings and triage: (F1, accepted) the
supportedverdict broke the pre-registered cap, so it isinconclusive; a re-registered G3 in a follow-up (monotone in the member's unit PV shape, not in irradiance) could lift it. (F2, accepted) MP shuffles across lead and cloud band, so it is a weak placebo; the audit's stricter shuffle keeping lead day and cloud band scores -0.78% in the scored year and -0.33% in the replicate months, and M beats it by -1.47% (-1.83% to -1.10%) and -1.43% (-2.04% to -0.82%). About two thirds of the gain needs the day's own members. (F3, accepted) the audit's Gaussian with each row's own mean and spread of the member responses scores -2.13%, so arm S failed through its inputs and form. (F4, accepted) the widths are means, and three BG2-gap figures were corrected. The gap to BG2 moved by 0.018 MW against a predicted under 0.01, so that part of the prediction failed too. MR and MP were added to the plan after it was committed. No leakage was found, the month-block bootstrap is correct (re-blocking replicate months by origin gives -2.52% to -1.05%), and C1 stays negative leaving out any substation (-1.89% to -2.50%) or any month (-2.00% to -2.44%). The report is private (data/ml-experiments/briefs/e184_audit_report.md). - Prediction check. The pre-registered expectation (probability about 0.7) was that no arm would reach -1%, that arm M would change the score by -0.5% to +1.0%, and that any gain would sit under 72 hours and that the gap to BG2 would change by under 0.01 MW. Arm M's -2.2% and its larger gain beyond 72 hours contradict all three, and the result also contradicts experiment 169's null on ensemble spread. The placebos MR, MP, and SP test the explanation that widening alone produces the gain, and none reproduces it. Audit triggers fired: the failed monotonic check of G3, and a result that contradicts its prediction and an earlier experiment.
- Caveats. Arms M and F add a 51-member pass of the solar term to the weather layer and four fitted factors. The result depends on the weather layer's shape function, which falls with irradiance at low sun. The factors below 1 show that the offsets of arm A and the member spread overlap, as experiment 125 expected. The pass shifts daylight medians below the mean by 0.05 to 0.14 points. No term of the best-guess stack beyond arm A was tested on top. The replicate months hold only 6 months, so their intervals are wide.
- What to try next. (1) Test the member pass inside the full best-guess stack and score the curtailment-cost proxy for the lower tail. (2) Check the production cost of the 51-member solar response. (3) A learned scale on the member responses (a small neural network) is a candidate extra arm; its prediction that could fail is that it beats M's -2.2% on partly cloudy rows without widening night.