Experiment 182: do D8's multi-day drops coincide with failed analogues of its two disaggregated farms?
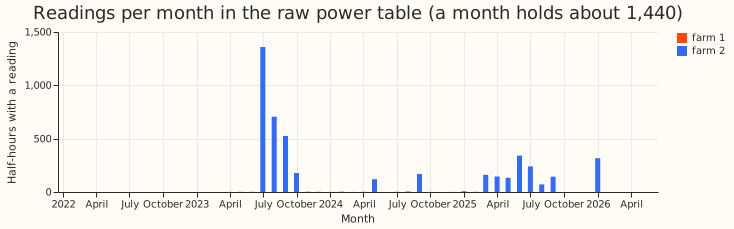
The two farms' own readings cannot answer the question, because they are absent from the power
table for the whole period of the drops. D8 (Marsh Lane) is a disaggregated Primary substation:
the metadata table says the output of two solar farms was added back to its reading, and that the
analogue (the stand-in measurement that supplies each farm's output) of both farms is "not
working". Experiment 159
found 29 multi-day drops at D8 that no neighbour step or detector explains. The hypothesis was
that, when an analogue fails, D8's reading loses that farm's output, so a drop equals the lost
output. Farm 1 has one reading in the power table, and farm 2 has 4,643 readings, of which 441
are above zero and none come after 2026-01-26. The farm reading is therefore "missing" inside all 29
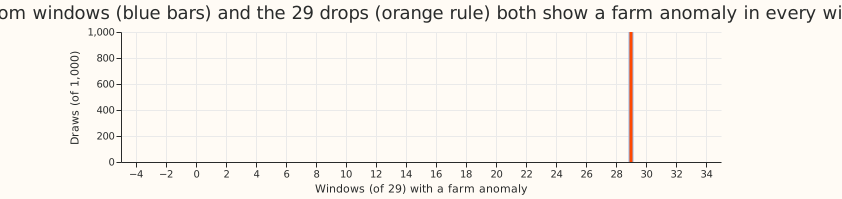
drops and inside every random window (Figure 2), so the pre-registered count (at least 15 of 29
against at most 5 for random windows) cannot be met on the random side. The verdict is
inconclusive.
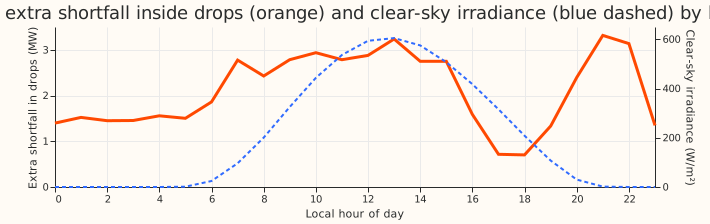
D8's shortfall does lean towards daylight. In 24 of the 29 drops the shortfall (expected minus metered power) is deeper from 10:00 to 15:00 local time than from 22:00 to 04:00, by a median of 1.5 MW (bootstrap 95% interval 0.5 to 3.7). The hourly extra shortfall inside drops correlates with clear-sky irradiance at Spearman +0.44 (p = 0.033) across the 24 hours, against -0.12 outside drops. The extra shortfall is also large at 20:00 to 22:00 (2.4 to 3.3 MW), which a solar farm cannot explain, so the daylight pattern is a hint and not a signature.
Results
- Farm readings: farm 1 has 1 reading on the grid (a zero on 2024-09-26) and farm 2 has 4,643 (2023-04-11 to 2026-01-26), 441 of them above zero and the last on 2026-01-23. Farm 2 is typed "Other (Generation)" in the metadata table, so it need not be solar.
- Per-drop status in daylight (Figure 2): farm 1 is missing in 29 of 29 drops, and farm 2 is missing in 28 and all-zero in 1. In the 7 days before a drop, farm 2 is missing in 28 and normal in 1. A farm anomaly that was not present in the previous 7 days appears in 1 of 29 drops, against a mean of 0.5 in 1,000 random draws (share of draws at or above 1: 0.37).
- Farm output against drop depth: the farms' combined daylight median over the 7 days before is 0.0 MW in the 10 drops that have any reading there, against a median depth of 2.71 MW. The other 19 drops have no reading to compare.
- Random windows: 1,000 draws of 29 windows of the same lengths and times of day, from 2023-07-01 onwards, show a farm anomaly in 29.0 of 29 on average (5th to 95th percentile 29 to 29).
- Depth by hour (Figure 3): the extra shortfall inside drops is about 1.5 MW from 00:00 to 06:00, 2.4 to 3.2 MW from 07:00 to 15:00, 0.7 MW at 17:00 to 18:00, and 2.4 to 3.3 MW from 20:00 to 22:00. Per drop, the Spearman correlation of hourly depth with clear-sky irradiance has a median of +0.49 and is positive in 23 of 29 drops.
- Metadata
informationfield: 5 of the 33 series have a value. They are D8's own note about the two disaggregated farms, "Analogues not working" for the two farms, "Analogues suspect" for one of the six metered solar farms of experiment 179, and "Customer has not exported since June 2026" for a biofuel generator. The last two are not connected to D8, so no other note explains a D8 anomaly. - Raw JSON: in the files read for D8 and the two farms (15.8 MB: the whole-history file and the
first and last six-hour file of each series), every reading holds only
startTime,endTime, andvalue, and the top-level fields are the ones the metadata table stores. TheInformationfield is null in the whole-history file (to 2026-03-26) and set in the July and October 2026 files, so the notes are a snapshot and the files carry no history of when an analogue failed.
Checks
- Drop table and panel: the drops are the 29 of experiment 159, unchanged. D8's expected power is the frozen convex demand model of experiment 130, so "shortfall" is relative to that model.
- Daylight rule: daylight is clear-sky irradiance above 50 W/m² at D8's location, and one rule (under half present, all zero, or 6 or more identical positive readings) is applied to both farms.
- Triggers for audit: none fired, because no forecast is scored.
Caveats and next steps
- The test cannot discriminate because absence is the baseline for both farms, not because the hypothesis failed.
- The hourly pattern comes from 29 drops chosen by their depth in the residual, and the evening peak has no solar explanation.
- Next, either obtain the farms' output and capacity from NGED, or model them from capacity and weather estimates and compare with the drop depth by hour. A neural component is not suggested, because the limit is missing data.