Do the six metered solar farms show an AC clipping plateau, step drops, or slow drift, and is their cleaned series fit to reuse?
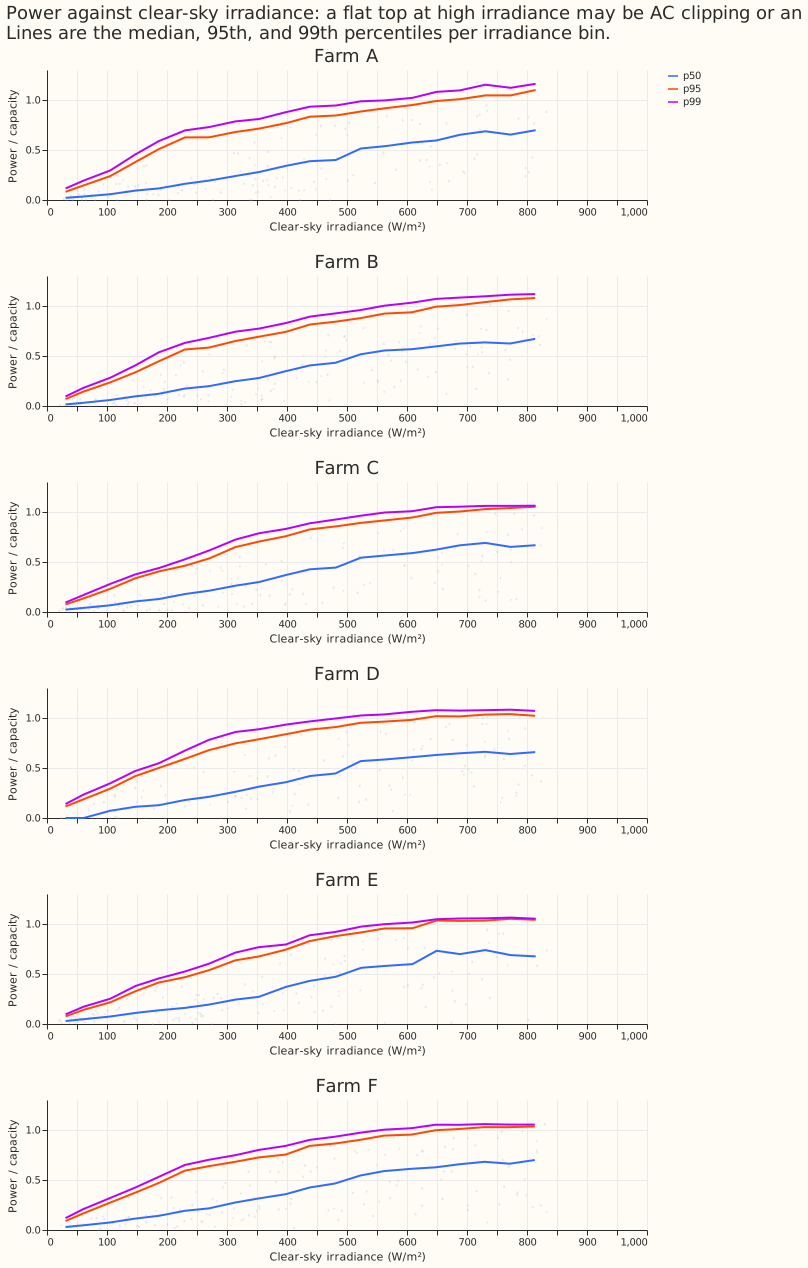
Four of the six metered solar farms (C, D, E, and F) flatten at about 1.05 times their capacity at
high clear-sky irradiance. The pre-registered test found only two farms, and the flat top may be an
export cap rather than AC clipping. We asked whether the six metered solar farms of the trial area
(labelled A to F, which anonymises them) show alternating-current (AC) clipping, step drops
(outages), or slow drift (soiling or degradation). AC clipping is output flattening at the
inverters' alternating-current limit, below the direct-current (DC) capacity of the panels. We
plotted each farm's half-hourly power over capacity against clear-sky irradiance from the Ineichen
clear-sky irradiance model in the pvlib solar library. We then ran the data-validation
checklist, which looks for gaps, duplicates, stuck readings, spurious zeros, and timestamp errors,
and wrote a cleaned series in the private data folder, in which flagged half-hours stay in place
with a reason. No statistical or forecasting model was fitted.
Under the pre-registered rule, two of six farms (C and E) show clipping, against a prediction of at least four, so the stop rule fires. The stop rule says that follow-up 4 (DC versus AC loss) is dropped when fewer than three farms show clipping. It is therefore dropped for the other four farms.
The rule required the 99th percentile of power within 2% of the 95th at the three highest clear-sky irradiance bins, where each bin is one twentieth of the farm's clear-sky irradiance range. The 99th percentile is above that limit at four farms (A, B, D, and F), which noise or cloud-enhancement events (brief output above clear-sky level) could cause; this was not tested. A rule chosen after seeing Figure 1 (post hoc) asks only that, over the top three bins, the 95th-percentile power rises at under 25% of the rate at which it rises over the lower-middle bins. The pre-registered rule is applied to the binned median, as written; a variant on the 95th percentile finds only E. The post hoc rule finds clipping at farms C, D, E, and F. The maintainer decides whether the stop rule stands.
Checks
- Clipping tests (
clipping_tests.csv), per farm A to F: the ratio of the 99th to the 95th percentile over the top three bins is 1.08, 1.05, 1.02, 1.04, 1.02, and 1.02. The ratio of the binned-median slope over the top three bins to its slope over the lower-middle bins (the pre-registered test, limit 0.10) is 0.14, 0.47, −0.28, −0.04, −0.82, and 0.22, so C and E pass both tests. The same slope ratio on the 95th percentile (post hoc rule, limit 0.25) is 0.85, 0.46, 0.15, −0.09, 0.06, and 0.07. - Other causes of a flat top: power was compared with clear-sky irradiance on a horizontal plane, not on the panel plane, so panel tilt and azimuth, and summer heat derating, can flatten power at high sun without any clipping. The highest bins hold only midsummer midday half-hours, so season and irradiance are confounded. Farm C's 95th percentile is still rising in the top bin.
- Plateau level: the 95th percentile peaks at 1.10, 1.08, 1.05, 1.04, 1.05, and 1.04 times effective capacity for farms A to F. If effective capacity is itself estimated from the observed output, a plateau near 1.0 is partly by construction; this was not checked.
- Export cap confound: an export cap produces the same flat top, and
studies.export_capwas not applied. Clipping and curtailment are not separated. - Timestamp convention: each timestamp marks the end of its half-hour. Power correlates best with clear-sky irradiance at lag 0 for all six farms, which is consistent with that convention.
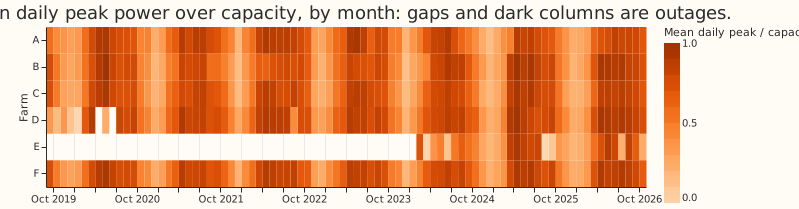
- Gaps: 7.6% (B) to 27.6% (E) of half-hours are missing, and 22.4% at D. There are no duplicate timestamps.
- Zeros in clear sun: 134 to 1,291 half-hours per farm read zero or less when clear-sky
irradiance exceeds 500 W/m², flagged
zero_in_clear_sky(outage or curtailment). These are the counts in the cleaned series; the raw count invalidation_checks.csvis 250 to 1,291 and includes E's commissioning period. - Stuck runs: 3 half-hours at D only (six or more identical positive daylight readings).
- Negative readings: 0 to 24 half-hours per farm. Night-time readings above 2% of capacity: 0 to 30 half-hours per farm.
- Commissioning: 9,226 half-hours at E before 2024-10-06 are flagged, as
studies.commissioningalready does. - Step drops: the test finds total outages only, so a partial outage or missing data goes
unseen. Four runs of three or more April-to-September days with peak under 5% of capacity
(
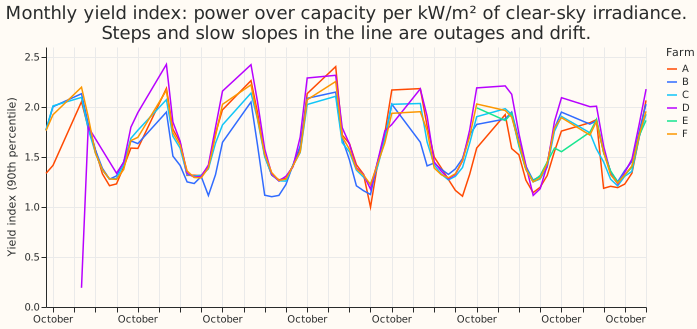
candidate_outages.csv; a run may span a data gap): B from 2022-08-09 (3 days), D from 2022-08-10 (5 days) and 2022-08-27 (3 days), and E from 2025-09-20 (4 days). - Slow drift (trend of the monthly yield index after removing month means,
drift.csv, 90% interval from resampling months), farms A to F, in percent per year: −0.55 (−1.5 to +0.4), +0.93 (+0.2 to +1.7), −0.53 (−0.9 to −0.1), −0.08 (−0.9 to +0.6), −1.8 (−4.8 to +1.6, 18 months only), and −0.21 (−0.6 to +0.2). One month at D (February 2020, a partial outage) is left out of the fit. Drift is not detected at A, D, E, or F, with wide uncertainty. B and C have intervals that exclude zero but are small, and the fit includes months with 20 to 25% partial outages. - Replication status: the count of farms with clipping is unreplicated, and the post hoc rule is exploratory; no other experiment or data set has confirmed either.
- Audit triggers: the audit trigger for a result that contradicts its own prediction fires in form. The explanation, a too-strict rule, was tested by the post hoc rule above. The trigger for a later design that depends on an unreplicated result applies, because follow-up 4 depends on the count. This experiment has no control, nested arm, or leave-one-out check. No audit was run; the manager decides whether one is needed.
What the next experiment should answer
- Does each farm's flat top coincide with export-cap hours (
studies.export_cap)? - What is each farm's DC capacity from an independent source, so that the AC limit can be separated from it?
- Does a small learned clipping response (a smooth saturation of power against irradiance) fit farms C, D, E, and F better than a hard cap at 1.05 times capacity? The prediction that could fail is that it fits no better.