Data sources
The inputs to the forecasting system: NGED's power-flow data, supporting NGED files, and weather data.
Status legend — ✅ Ingested today · 🚧 Planned ingestion · 🔬 Research. The ECMWF ENS NWP and the NGED time-series JSON / metadata are ✅ ingested; the supporting NGED files and the extra weather datasets are 🚧 planned (needed for switching-event detection and capacity estimation), and NGED's published electricity-network model is 🔬 research. See the roadmap index for status conventions.
Data from NGED
Provided on NGED's AWS S3 bucket (live, updated every 6 hours)
| Source | Status | Description |
|---|---|---|
| Time-series JSON files | ✅ | Half-hourly power flow + metadata per substation / customer meter in the trial area. Ingested by OCF to produce operational forecasts. Each reading is a period-ending mean — power averaged over the preceding 30 minutes, with time marking the end of that window, as PowerTimeSeries in packages/contracts/src/contracts/power_schemas.py records. The irradiance ingest is chosen to match, so Weather data prefers a source that accumulates over the interval to a source that samples an instant. |
| Curtailment (active network management) | 🚧 | Half-hourly megawatts lost to an active-network-management (ANM) instruction, per curtailed generator. Crucial for distinguishing deliberate ANM ramp-downs from genuine faults or capacity loss. What the feed holds, and how far back it reaches, is below. |
What the curtailment feed holds
Curtailment reaches us two ways, and the export cap is the one to build on. The curtailment/
prefix sits beside timeseries/ on the bucket, on the same six-hour window convention, and each
object carries a data list of {startTime, endTime, value} at half-hourly resolution under a
header naming the generator, its substation number, its licence area, and a CurtailmentType such
as ANM (DANM and TANM). Its value is a derived volume of megawatts lost. Separately, NGED can
export the raw active-network-management setpoint history on request, one row per change of the
generator's export cap — the signal the derived volume is computed from. Nothing in this repository
ingests either yet.
Prefer the setpoint history: it reaches further back and it is the physical quantity. For the
one generator both cover, the setpoint history runs from February 2024 against the bucket feed's
late April 2026, and the two disagree on the hours they share. The cap is also what a model can use
directly, because export cannot exceed it: a generator's output is min(what the weather allowed,
the cap in force). The cap is published as a negative number, generation being negative in NGED's
convention, and its largest magnitude is the connection limit rather than a curtailment. Reading
the cap as a curtailment volume gets this backwards — the measurements are in the beam/diffuse
results.
Ask for the whole history, and expect the first request to be truncated. The first export we were sent for that generator began in July 2024; a second request returned an exact superset reaching back to February 2024, the day the generator's telemetry begins. Nothing in the first file said it was partial.
The setpoint feed reads zero for months before the scheme enforces anything, so find the go-live date before trusting a single reading. Across all 431 bright hours the export covers before 6 August 2024, the cap forbids export outright — while the generator exported above 5% of capacity in 423 of them, at a median of 44%. An ingest that honoured those readings would label a plant running normally as a plant held at zero, and would do it silently. Take the scheme as live from the first half-hour at which the cap reaches the connection limit: a live scheme on an unconstrained generator rests at that limit most of the time, and the marker needs no reference to metered output. Eight of the 2,268 rows also carry a positive value where the rest are negative, so read the magnitude rather than flipping the sign.
One generator in the trial area is connected under active network management, and NGED has confirmed there are no others. Within the trial area a generator absent from the setpoint record therefore ran free, which is what lets an absent cap be read as evidence rather than as a gap. That confirmation does not extend past the trial area: at rollout the population of flexible connections has to be established again, and until it is, an absent record means only that NGED has not sent curtailment for that generator. The setpoint export is per generator, so widening it to a new set of sites is a fresh request each time.
15-minute power data may become available. We deliberately stay on half-hourly until v2. There is no room on the road to v1.0 to re-ingest the power feed at a finer step, so treat 15-minute data as a v2 item.
Power forecasts stay half-hourly regardless, so the change is confined to the ingest. Averaging
each pair of 15-minute readings into the half-hour ending at :00 or :30 leaves the training
grid, the metrics, and the leaderboard exactly as they are, because two period-ending 15-minute
means average to the period-ending 30-minute mean the contract already specifies. Everything
downstream stays correct on that basis — _upsample_nwp_to_half_hourly, the inference spine in
production_helpers, and the row-wise forecast metrics all assume a fixed half-hourly step and
would keep getting one. The milestone that actually wants a finer step is v2 disaggregation, which
can read it from a separate table rather than by widening PowerTimeSeries.
Do that averaging explicitly, because today's ingest would silently keep the wrong half of each
half-hour. PowerTimeSeries.drop_implausible_rows filters to readings aligned to :00 and :30,
logging a count and raising nothing. Fed a 15-minute series it would discard every :15 and :45
reading and keep the :00/:30 ones — each of which covers only the preceding 15 minutes. The
result is the second quarter-hour of every half-hour wearing a half-hourly label. validate then
passes, because the survivors are a well-formed half-hourly series, and the Dagster asset
materialises green, because the drop count only warns. Around sunrise and sunset, where irradiance
ramps inside the half-hour, that bias is systematic rather than noise. Changing PowerTimeSeries is
a data-contract change, so it needs sign-off under the rule in packages/contracts/README.md, and
the averaging rule needs to say what happens when one reading of a pair is missing.
Provided as reference files (mostly static reference / historical)
| File | Status | Description | Known issues |
|---|---|---|---|
| Historical time-series JSON | ✅ | Historical outputs of substations and customer meters. | See data quality. |
| Monitor Direction.csv | 🚧 | Metadata for all substations: meter (analogue) type and power-flow direction. | One solar park's (ID 30) substation number differs from its metadata, to be confirmed with NGED; other sources agree, so low risk. |
| Primary Substation Interconnections.csv | 🚧 | List of possible connections between primary substations (not all are in the trial area). | All trial-area substations have ≥ 1 connection; topology appears complete. |
| Substations.csv | 🚧 | For each substation, bulk supply point (BSP) and grid supply point (GSP): which BSP & GSP it connects to (names + IDs). | All trial-area substations valid. |
| Switching Logs.xlsx | 🚧 | History of every normally-open switching point between primaries, labelled by time-series ID. Primaries outside the trial area are labelled "Unknown". | Extremely valuable as the gold-standard test set for switching-event detection — lets us validate the unsupervised method on the trial area (labels do not exist at scale). Some edges "collapse" into [substation ID] – unknown. Two edges present in Interconnections.csv are missing: 900016 (ID 10) ↔ 900019 (ID 13), and 900022 (ID 16) ↔ unknown (910026). Logs go back to ≥ 2019. |
| MPAN to Substation Number.csv | 🚧 | Associates each Embedded Capacity Register (ECR) generator to the substation it connects to. | All trial-area generators present, each with two Meter Point Administration Numbers (MPANs, import + export). Three primaries appear with one MPAN each, to be confirmed with NGED. |
| Peak Loads.xlsx | 🚧 | Manually selected peak demand per trial-area substation, from 2024/25 (most recent survey). | Covers all 16 trial primaries. Of these, 12 have 2024/25 readings above the recorded peak. Even at the 99th percentile of observed power, 3 primaries (IDs 8, 13, and 25) show 2–4× the recorded peak. One other primary has a recorded peak above 14 MVA, but its telemetry has never exceeded 6.8 MVA. Given these discrepancies, we use the 99th percentile of observed power as the substation "capacity" proxy, at least initially. |
NGED's published electricity-network model (the Long Term Development Statement)
NGED publishes a description of the electricity network itself, and that description does not arrive in Flexpectation's pipeline. The two tables above list what NGED sends. The Long Term Development Statement (LTDS) is separate. The LTDS sits on NGED's open-data portal in two forms. The LTDS describes the wires rather than the power flowing through them.
| Dataset | Status | Description |
|---|---|---|
| LTDS Tabular Model | 🔬 | Comma-separated tables covering circuits, nodes, two- and three-winding transformers, demand, fault levels, and generation, across NGED's four licence areas. |
| LTDS Common Information Model | 🔬 | The same electricity network in the Common Information Model format, as one archive per licence area, covering 132 kV grid supply points down to 11 kV or 6.6 kV primaries. A separate lookup table maps the model's substations to NGED substation numbers. |
Between them, the two publications carry the per-branch impedances and thermal ratings a power-flow model is built from. Flexpectation holds neither anywhere else. The circuit table holds 22,516 rows. Of those, 6,145 carry positive- and zero-sequence impedances and four seasonal thermal ratings, at 132, 66, 33, 11, and 6.6 kV. The rest are switching devices such as disconnectors, which have no impedance.
Three planned pieces of work would draw on the two publications:
- Tier 3 curtailment costing, which is out of scope today for want of exactly this model.
- Switching-event detection, which reasons about which substations can exchange load.
- Capacity estimation, which needs a firmer limit per node than the 99th percentile of observed power.
No Flexpectation code reads either dataset. Two questions have to be answered first. Do the LTDS
node names join cleanly to the time_series_ids Flexpectation forecasts? The Common Information
Model's substation-number lookup is where that join would start. How far below the primary
substations does the published model reach? Neither question has been investigated.
Data quality & availability
Machine-learning models are only as good as their training data. Known characteristics of NGED's historical data (full detail + plots in the Milestone 1 report, Appendices A & B):
- Most trial-area time series go back to late 2019 (≥ 6 years). Exceptions: Wrangle primary (ID 12) and ID 13 have only ~1 year.
- The first ~2 months of each series tend to be poor quality (meter ramp-up / calibration) and are dropped during cleaning.
- Gaps: a couple of missing points every few weeks, especially recently for generators. Solar generators legitimately don't report overnight, but not all gaps are nighttime; gaps can last hours to months.
- Meter quality flags: some meters carry NGED's own quality flags ("analogue not working" or "analogue suspect"), which ingestion does not yet act on.
- False zeros: substation telemetry has occasional drop-outs to zero, visible as an excess of exact zeros in the distribution vs. near-zero values.
- Not-on assets: one trial-area generator (ID 19) has not been operating since mid-2024 — motivating the building-blocks delivery approach.
- MVA / reverse flow: primary data is disaggregated from metered generation where possible, but not always. The primary with ID 26, for example, has two solar meters that are not reporting, so their generation cannot be subtracted. Combined with MVA metering (which reports absolute value), midday solar export "bounces" off zero and looks like extra load. See also the MVA discussion in Net-demand disaggregation.
These data oddities are detected and reported back to NGED as warnings (see delivery tables, Table 2).
NGED's network (context)
As of May 2026, NGED's full network (the v2 target scope) consists of:
- 1,161 primary substations (33/11 kV & 66/11 kV)
- 271 bulk supply points (BSPs) (132/33 kV & 132/66 kV)
- 52 grid supply points (GSPs) (400/132 kV & 275/132 kV)
- ~1,500 generators (industrial customer generators, not domestic):
- 558 connect directly to GSP/BSP busbars at 33 kV or 132 kV (modelled by NGED as generation-only "substations"; mostly have telemetry; curtailable via ANM; comprising 329 solar, 63 wind, 166 other).
- ~1,000 are on the 11 kV network downstream of primaries; some metered, some not.
- Power flow from metered generators connected to primaries is already subtracted from the primaries' power flow ("Disaggregated Demand").
The Embedded Capacity Register behind these figures has limits worth naming, because both capacity estimation and disaggregation build on the register. The register records generation of 50 kW and above. The capacity recorded is the export limit a site's connection agreement permits rather than what the site can actually generate, which is why Flexpectation needs to estimate effective capacity rather than reading nameplate capacity off the register. Below 50 kW the register is silent. Most of the panels sit below 50 kW, too: of the 22,560 MW of solar photovoltaic capacity installed in GB by the end of July 2026, 8,503 MW sits in arrays smaller than 50 kW. Recovering solar on that scale, with no register to check the answer against, is what disaggregation has to do. The figures come from the energy-forecasting review, which cites the Department for Energy Security and Net Zero's solar deployment statistics.
The v1 trial area is 32 of these time series — see the roadmap index for the breakdown.
Weather data
Issues: #142 (CAMS solar radiation), #143 (reanalysis ingestion — ERA5)
The table below lists the weather products the project ingests, plans to ingest, or is researching as a possible source. The Status column says which, and several rows are marked uncertain, deprioritised, or unlikely. Products researched only for the studies are on the weather products survey page.
ECMWF's own models, Google DeepMind's WeatherNext 3, and NOAA's GFS and GEFS reach NGED's 14-day forecast horizon; every regional model on this page stops at 7.5 days or less.
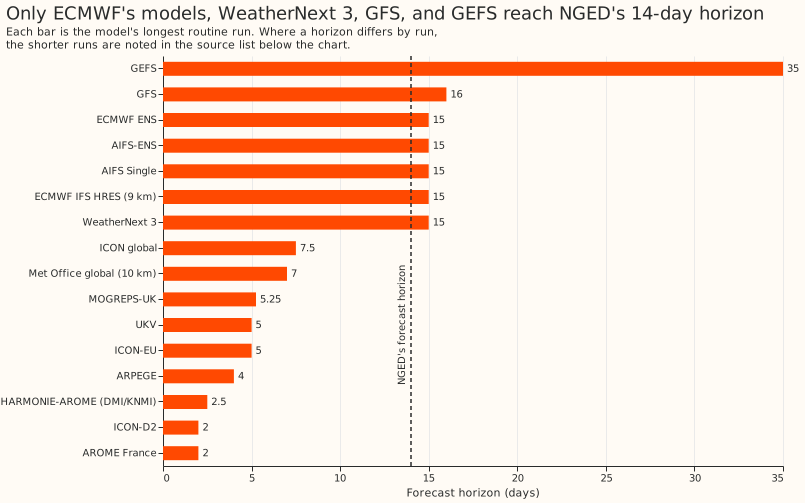
Each bar is the model's longest routine run, taken from this page, from the weather products
survey's forecast-model table, or from
the producer's own documentation — the
source for every bar is recorded next to its horizon in studies/beam_diffuse_split/nwp_horizons.py.
Reanalyses and satellite products carry no forecast horizon and are left off.
| Source | Status | Description |
|---|---|---|
| ECMWF ENS (Dynamical.org) | ✅ | Main NWP source: 51-member ensemble, distributed as live-updating Zarrs. OCF converts gridded NWP to tabular via the H3 spatial index and stores as Delta Lake, stored as Float32 rounded to a 13-bit significand, with zstd compression (~40 GB/year for all of GB; ~1 minute to download+convert one day). The archive currently only extends back to 2024-04-01; Dynamical.org are back-filling the operational archive from MARS to 2016-03-08 (51 members, 0.25°, 00Z inits only), but at ~0.8 TB/day against ~446 TB remaining the estimate is ~November 2027 — after v1.0, which is why we extend the training history with ERA5 instead. Radiation: no direct component, which is what forces DP forecasting of PV (v2) to find the beam/diffuse split elsewhere — see which sources carry which irradiance components. |
| ERA5 (ECMWF global reanalysis) — the project's reanalysis | 🚧 (v0.5) | The single reanalysis we ingest, serving both pre-training and near-real-time capacity estimation. Covers 1940 to the present — far enough back to pre-train on the long power histories that predate the ENS archive (2024-04-01). Its 31 km resolution is coarser than CERRA, which is acceptable because weather anomalies are synoptic-scale and the high-resolution solar irradiance comes from CAMS regardless. Carries the beam/diffuse split, which the live ENS feed does not. Its ERA5T near-real-time stream lands ~5 days behind real time, and final ERA5 overwrites it ~2–3 months later after quality control. Shares the ECMWF IFS lineage with the ENS forecasts, so systematic biases largely cancel when the two are combined. Ingest 2020 to present, including the 2024+ ENS overlap, which is not optional — see Extending the training history. Which access route is still open. |
| CERRA (Copernicus regional reanalysis for Europe) | 🔬 (deprioritised) | Higher-resolution (5.5 km) European reanalysis. Per the Copernicus CDS, it now runs from September 1984 to the present — monthly updates, but about 3 months behind real time: on 2026-09-23 the latest data ended 2026-06-30, 12 weeks earlier. Superseded by ERA5 for the active plan: that latency of about 3 months rules it out for near-real-time capacity estimation, ERA5 reaches further back for pre-training, and we prefer to ingest a single reanalysis. Kept here because its 5.5 km resolution could still earn a place for fine-scale work (e.g. wind over complex terrain) if that ever proves decisive. Its direct short-wave is time-integrated from 3-hourly forecast cycles, so temporally coarser than SARAH-3. On past sunshine at six solar farms, an XGBoost model given CERRA's global irradiance is no better than one given ERA5 and 4.045 points of capacity behind one given CAMS (9.164% against 9.135% and 5.118%, on the CERRA row set; results). Grid, coverage, wind heights, and access are in the survey's reanalysis table. |
| CM SAF (Satellite Application Facility on Climate Monitoring) | 🔬 (v2 comparison) | SARAH-3 carries every irradiance component on a 0.05° grid at 30 minutes from 1983. Two reasons SARAH-3 is not the first ingest. Its climate data record ends 2020-12-31 and the Interim Climate Data Record extends that record, putting a version seam inside the 2019-onward history we train on. And its 30-minute values are instantaneous snapshots, whereas CAMS accumulates over the step, which is what a period-ending meter reading measures — under broken cloud an instantaneous sample and a 30-minute mean can differ a lot. Its gridded delivery would suit the H3 pipeline better than CAMS point requests, and comparing the two resolutions is not straightforward, because the CAMS point service interpolates to the requested location rather than publishing a grid. Latency is 2–5 days (Pfeifroth et al. (2024)), immaterial offline. Worth a genuine head-to-head against CAMS in v2 — see Correcting satellite irradiance over Great Britain. |
| CAMS solar radiation (Copernicus Atmosphere Monitoring Service) | 🚧 (v0.7) | The satellite-derived irradiance we ingest, used to estimate solar PV capacity. Used offline only — capacity estimation runs over history, and the production serving path takes no dependency on it. The CAMS Radiation Service carries every irradiance component, under both clear sky and observed cloud, from 2004-02, under CC-BY-4.0, at steps of 1 minute, 15 minutes, 1 hour, 1 day, or 1 month — the beam/diffuse split the DP solar model needs. Cloud information comes from Meteosat Second Generation; aerosol, ozone, and water vapour come from the CAMS global forecasting system, so aerosol optical depth is a 3-hourly analysis rather than SARAH-3's monthly climatology. Values are interpolated to the requested location rather than served on a grid. Chosen over SARAH-3 on delivery and record continuity, not on measured accuracy over Great Britain — see CAMS: use the point API, not the gridded product for the route and its traps, and Correcting satellite irradiance over Great Britain for what is known about this source's error and what v2 might do about it. |
| ICON-EU (Dynamical.org) | 🔬 (v0.9, uncertain) | Possible additional NWP source to test whether it improves skill over ECMWF ENS: a deterministic run from DWD, Germany's national weather service, on a ~6.5 km grid, 4 runs a day out to 5 days. Already carries the beam/diffuse split the PV forward model needs, and holds the earliest roadmap slot of any source that does. Starts early 2026, so it can't enter the canonical CV folds directly — assessed via ad-hoc ablation first. Archive start, latency, and access routes are in the survey's forecast-model table. |
| AIFS-ENS (ECMWF) | 🔬 (v2.1, uncertain) | ECMWF's machine-learned ensemble, now operational with the same 51 members and 15-day horizon as the physics ensemble, and more accurate than it on the majority of variables and lead times (Lang et al. (2026)). Whether that translates into a better substation-load forecast is an open question. AIFS-ENS member n starts from the same initial conditions as ECMWF ENS member n, so the two can be fed side by side rather than swapped. Unlike the physics ensemble, AIFS has no direct-beam field to ask for at all, in either the ensemble or the deterministic AIFS Single: on the 2026-09-19 00Z run, AIFS-ENS open data carries 29 parameters and AIFS Single 30, and ssrd and strd are the only radiation fields in either. Both AIFS streams arrive on 6-hourly steps across the whole 15-day horizon — 61 steps, against the physics ensemble's 85 — where the physics ensemble is 3-hourly out to 144 hours and only then drops to 6-hourly. Twice the step width over days 0 to 6 costs most on irradiance, whose diurnal cycle varies faster than any other field we use: the reconstructed solar day lags the true one by half a step width, so 3 hours at AIFS's steps against 1.5 hours at the physics ensemble's, and the modelled clear-sky peak falls from 816 W m⁻² to 756 at 3-hourly steps and 590 at 6-hourly. Same folds problem as ICON-EU: the archive starts mid-2025, so it is an ad-hoc ablation before it is a canonical source. Archive start and access are in the survey's forecast-model table. The evidence on whether AIFS improves faster than the physics-based IFS, and the reason each AIFS version is scored separately, are in the survey (evidence, version eras). |
| WeatherNext 3 (Google DeepMind) | 🔬 (after v2, unlikely for production; ensemble-mean fetched for a study) | Google DeepMind's machine-learned 64-member ensemble (grid, cycles, and horizons are in the survey's forecast-model table), following Google's guide to WeatherNext 3 on Cloud Storage. 2 m temperature and dewpoint also arrive at 0.05°, from a neural-network output head trained directly on in-situ surface observations from airport stations, regional station networks, ships, and buoys (Rasp et al. (2026); model specs). Carries the beam/diffuse split the PV forward model needs, as named fields rather than by subtraction. The paper reports a lower continuous ranked probability score than ECMWF ENS on surface solar radiation, scored on the 6-hour accumulations rather than the hourly fields. Every radiation evaluation in the paper scores against an ECMWF analysis, and none scores against a surface measurement, so any irradiance gain would have to be measured downstream on power. Two structural differences from AIFS-ENS: all 64 members start from one analysis, so the ensemble's spread comes from the model alone rather than from perturbed initial conditions, and no member pairs with an ECMWF ENS member. Access needs a request form, and the survey gives the licence terms. BigQuery and Earth Engine serve six summary statistics per variable (the mean, and the 10th, 25th, 50th, 75th, and 90th percentiles), matching a third route: a Cloud Storage Zarr store of precomputed statistics, distinct from the 64-member store the ensemble itself sits in. The matched-lead study fetches the ensemble mean from that statistics store, cropped to a wide United Kingdom box and held in OCF's own Icechunk store (ocf-weathernext3-uk) — see the survey's findings for the route, the cost, and how to open the result. That fetch is a study input, not production ingestion: the folds problem remains worse than ICON-EU's or AIFS-ENS's, since the archive starts 2026-01-01 with no back-fill before it, so on current priorities we do not expect to reach this source for production inside the Network Innovation Allowance project. The survey lists the other AI weather models and commercial archives of AI forecasts under AI weather models beyond AIFS. |
| UKV and MOGREPS-UK (Met Office, via AWS) | 🔬 (uncertain) | The Met Office's 2 km deterministic UK model and its 2.2 km UK ensemble. Both publish every irradiance component as its own field, so neither needs a subtraction to give the PV forward model its beam/diffuse split, and both are free on AWS under British Crown copyright and CC BY-SA 4.0 (UKV, MOGREPS-UK). Verified by listing the met-office-atmospheric-model-data and met-office-uk-ensemble-model-data buckets rather than from the documentation. Neither the horizons nor the archives suit the canonical folds — MOGREPS-UK is held as a 30-day rolling window — see which feed carries a direct beam. How Open-Meteo archives UKV is in the survey. |
ERA6 is a future upgrade, not a current option. ECMWF began ERA6 production in March 2026, but the phased release runs from late 2027 (first 20 years) into 2028, so it is out of scope for the near-term milestones. When it lands it should drop in cleanly — same IFS family, a similar ERA5T-style near-real-time fast track — and at ~14 km (2× finer than ERA5) it would close most of the resolution gap with CERRA that motivates keeping CERRA on the list at all.
Which sources carry which irradiance components
The Met Office's UKV and MOGREPS-UK are the only forecast sources listed below that publish
global, direct, and diffuse short-wave as three separate fields in a free feed. Every other free
forecast source makes the reader recover at least one component by arithmetic. ECMWF's own direct
beam, fdir, is outside ECMWF's free open-data subset for both the single 9 km forecast (formerly
HRES; see the weather products
survey) and the ENS ensemble;
what taking fdir from ECMWF directly
involves is below. Both
reanalyses and both satellite products carry a direct component, where the free feed behind the ENS
forecast in production does not. That is why capacity
estimation plans on having the beam/diffuse split, while
forecasting has no route to the split through the feed it
uses today.
Four rows below, and AIFS Single in the AIFS row, are not in the catalogue above, because the project plans to ingest none of them: ECMWF's own ENS is the full-catalogue delivery route behind the free feed, the two ECMWF rows via Open-Meteo were researched only for the studies and are on the weather products survey page, AIFS Single has no catalogue row, and the Met Office's global 10 km model is the Met Office model Dynamical.org have on their tracker rather than one we have asked for.
| Source | Kind | Global | Direct | Diffuse | Where it comes from |
|---|---|---|---|---|---|
| ECMWF ENS via Dynamical.org | Forecast | ✅ ssrd |
❌ | ❌ | Free ECMWF open data on AWS |
| ECMWF ENS from ECMWF | Forecast | ✅ ssrd |
✅ fdir |
By subtraction | ECMWF dissemination or MARS, not the free subset (licence and delivery below) |
| ECMWF ENS 9 km Europe via Open-Meteo | Forecast | ✅ ssrd |
✅ fdir |
By subtraction | Open-Meteo's Ensemble API, live runs only (survey) |
| ECMWF IFS HRES 9 km via Open-Meteo | Forecast | ✅ ssrd |
✅ fdir |
By subtraction | Open-Meteo, from 2017 (survey) |
| ECMWF AIFS, both Single and ENS | Forecast | ✅ ssrd |
❌ | ❌ | Free ECMWF open data; no direct field exists in any AIFS feed |
| ICON-EU via Dynamical.org | Forecast | By addition | ✅ | ✅ | Free, already ingested by Dynamical.org |
| UKV (Met Office) | Forecast | ✅ | ✅ | ✅ | Free on AWS, CC BY-SA 4.0; all three components in every run the bucket's rolling two-year window still holds |
| MOGREPS-UK (Met Office) | Forecast | ✅ | ✅ | ✅ | Free on AWS, CC BY-SA 4.0; all three components, plus net short-wave; 30-day rolling archive |
| Global 10 km (Met Office) | Forecast | ✅ | ✅ | By subtraction | Free on AWS, CC BY-SA 4.0; 168-hour horizon, but no global field before the 2024-11-07 12 UTC run and none at T+168 before 2026-01-21 |
| WeatherNext 3 (Google DeepMind) | Forecast | ✅ | ✅ fdir |
By subtraction | Access request; CC-BY-4.0 once at least 1 hour old |
| ERA5 | Reanalysis | ✅ ssrd |
✅ fdir |
By subtraction | Free from the Copernicus Climate Data Store |
| CERRA | Reanalysis | ✅ | ✅ | By subtraction | Free from the Copernicus Climate Data Store |
| CAMS Radiation Service | Satellite | ✅ | ✅ | ✅ | Free, CC-BY-4.0; also direct normal, and every component under clear sky |
| CM SAF SARAH-3 | Satellite | ✅ SIS | ✅ SID | By subtraction | Free; also direct normal |
"By subtraction" means the diffuse component is global minus direct, and "by addition" means global is direct plus diffuse. Both are exact inside the model, and both inherit the errors of the two components they combine. For ECMWF the subtraction lands on a quantity close to, but not identical with, what a shadow-band diffuse pyranometer measures, for the reasons under two traps for whoever builds on ECMWF's direct beam. A source publishing all three components as their own fields, as UKV, MOGREPS-UK, and the Radiation Service do, needs no arithmetic at all.
Which feed carries a direct beam, and what asking for one would cost
ECMWF's own ENS carries the direct beam. The free open-data subset does not, and the free subset
is what Dynamical.org ingests. ECMWF's ENS
catalogue lists total-sky direct solar
radiation at the surface (fdir, paramId 228021) alongside global short-wave (ssrd, paramId 169),
on the same steps: hourly to T+90, 3-hourly to T+144, and 6-hourly to T+360. Reading the GRIB
(gridded binary) index of any single step of an open-data ENS run gives 47 parameters, with ssrd
among them and fdir not. Across all steps the union is 50 parameters, and fdir appears in no
step. Dynamical.org's ECMWF IFS ENS
dataset names ECMWF Open
Data on the AWS Open Data Registry as its source. So the variable Dynamical.org would have to add is
not in the feed they read. The single 9 km forecast is in the same position: the free subset's
oper index for the 2026-09-22 00 UTC run carries ssrd and not fdir. Open-Meteo serves that
forecast's direct beam, and the 51-member ensemble's direct beam over Europe, only because
Open-Meteo's
downloader
fetches fdir from ECMWF's dissemination system.
ENS fdir reaches us through Dynamical.org by no route open today, and through Open-Meteo only
live. Open-Meteo's Ensemble API serves the
51-member ensemble at 9 km over Europe with fdir, from the 00 and 06 UTC runs, but keeps no
history to train or backtest on
(survey). Commercial use needs a paid
Open-Meteo plan.
Taking fdir from ECMWF directly is a delivery contract with ECMWF, not a storage decision. The
route is ECMWF's dissemination or a MARS subscription in place of, or alongside, the free bucket.
Since 1 October 2025 ECMWF's whole Real-time Catalogue, fdir included, has been licensed CC BY 4.0
(ECMWF).
Delivery of the full catalogue "may involve service charges". Dynamical.org's live ENS store reads
ECMWF's free subset, although their back-fill of past ENS runs comes from MARS. The project has not
asked Dynamical.org whether that back-fill could carry fdir, or whether Dynamical.org would take
on a delivery feed for live runs. Dynamical.org already publish direct and diffuse short-wave for
ICON-EU, which shows that a missing variable was never the obstacle — the obstacle is which ECMWF
feed the open bucket holds, and which feed the bucket holds is ECMWF's decision rather than
Dynamical.org's.
The Met Office models are the request worth making, because their free feed already carries a
direct beam. The one open Met Office request on Dynamical.org's issue tracker is for the global
10 km deterministic model, which
publishes
global and direct short-wave and leaves diffuse to the same subtraction ECMWF would need. UKV and
MOGREPS-UK go further and publish diffuse as its own field, but neither appears on Dynamical.org's
tracker, so either would have to be asked for. None of the three Met Office models needs a
delivery feed that may carry a service charge, which is what sets them apart from fdir on ENS.
Every Met Office model brings a horizon problem, and two bring an archive problem. The global model reaches 168 hours, UKV reaches 120 hours on its 03 and 15 UTC runs and 54 hours on the rest, and MOGREPS-UK reaches 126 hours. No Met Office model covers NGED's 14-day horizon. A Met Office model would therefore sit alongside ECMWF ENS rather than replace the ECMWF feed, exactly as ICON-EU would. MOGREPS-UK is held on AWS as a 30-day rolling window, which rules out backtesting unless we archive the feed ourselves from the day we start. What we learnt about MOGREPS-UK gives the size of that archive and the one other source of history we found.
A backtest on the global 10 km model starts at its 2024-11-07 12 UTC run, not at the start of its
archive, because no earlier run carries global short-wave. Listing every 6-hourly run the bucket
held on 2026-09-19, back to its earliest at 2024-09-19 18 UTC, shows
radiation_flux_in_shortwave_direct_downward_at_surface throughout and
radiation_flux_in_shortwave_total_downward_at_surface only from 2024-11-07 12 UTC onwards. That
run carries 4,470 files against the 4,310 of the 00 UTC run the same day, the extra 160 being global
short-wave at 78 lead times and cloud_amount_on_height_levels at 82. Compare runs at the same
hour: the 06 and 18 UTC runs stop at 54 hours and carry about 2,842 files whatever their date.
Global short-wave then stayed one lead time short of the direct field for another 14 months, and the missing lead time is T+168 — the one a 7-day horizon exists for. Runs settle on 2024-11-13 at 88 lead times against the direct field's 89, and every 00 and 12 UTC run from then until 2026-01-21 00 UTC drops T+168. The first run carrying global short-wave at all 89 lead times is 2026-01-21 12 UTC. A backtest that needs the full 168-hour horizon therefore starts there, 14 months after the field first appears.
UKV and MOGREPS-UK need no cut-off of either kind. Both carry global, direct, and diffuse short-wave at the same lead times as each model's other hourly fields — 55 for a UKV run reaching 54 hours, 126 for a MOGREPS-UK run — with no component lagging another. That holds in the earliest UKV run on AWS and in the earliest complete MOGREPS-UK run, the oldest surviving run of a 30-day rolling window being part-deleted rather than whole.
What we learnt about MOGREPS-UK on 2026-09-26
Each MOGREPS-UK object on AWS expires 30 days after it is written, so the oldest runs are already
partial. The anonymous bucket met-office-uk-ensemble-model-data holds 24 runs a day, one every
hour, under prefixes of the form uk-ensemble/YYYY/MM/DD/THHMMZ/. Each run reaches 126 hours and
has 3 members, and the realisation IDs of those members differ from run to run. One file holds a
single variable at a single lead time for all 3 members. An uncropped run has 14,330 such files and
about 258 GB in total, of which the archive's chosen fields are 3,744 files. Objects expire one by
one (the x-amz-expiration header gives each object's date), which is why the oldest runs are
already partial.
Shortwave has 126 hourly steps and looks instantaneous. Shortwave has no step 0, no
cell_methods, and no time bounds, and its time equals the valid time. Shortwave therefore looks
like an instantaneous value, unlike DWD's shortwave, which averages since the initialisation time.
Cloud and height-level fields have 127 hourly steps, and screen-level temperature and 10 m wind have
15-minute steps to 11.75 hours and hourly steps after that (163 steps). The 100 m wind field is on
33 height levels. The grid is 970 by 1042 points in a Lambert azimuthal equal-area projection.
Recording one full run cropped to Great Britain takes 29 minutes and stores 1.06 GB. The run
took 5.5 GB of downloads and 54,282 requests with 8 threads. At one run an hour, the archive grows
by about 25 GB a day and 9 TB a year. About 40,000 of the requests fetch the 100 m wind files. Those
files gain nothing from extra threads, because the h5py library holds a global lock, whereas 4
processes gave about 4 times the throughput.
Open-Meteo holds the individual members for about 3.5 days and the ensemble mean and spread for
about 93 days. We probed one Great Britain point on 2026-09-26. The ensemble
API serves the 3 members as ukmo_uk_ensemble_2km,
hourly to 126 hours. Runs 1 to 3 days back were complete, 4 days back were half complete, and 5 or
more days back were empty. The historical-forecast and previous-runs APIs accept the model but
return only nulls, so Open-Meteo keeps no per-run history. The ensemble mean
API serves the mean as
ukmo_uk_ensemble_mean_2km, with spread as variables carrying a _spread suffix (a _mean suffix
is an error). The mean series starts on 2026-06-25, and we could not tell whether that start is a
rolling limit, because the API rejects earlier dates. The series is stitched from successive runs
rather than held per run, and its previous_dayN variables are null. The mean carries
temperature_2m, shortwave_radiation, direct_radiation, diffuse_radiation, wind_speed_10m,
and cloud_cover, and wind_speed_100m is all null. The spread is null for diffuse_radiation and
wind_speed_100m. The DWD ensemble mean dwd_icon_d2_eps_ensemble_mean carries 100 m wind and
dwd_icon_eu_eps_ensemble_mean does not, and we did not probe how far back either goes. The
deterministic UKV has stitched history on Open-Meteo from about 2022 to 2023, and its
previous_day1 variables start only in about 2025.
The only per-run, per-member MOGREPS-UK history we found is the archive that a recorder would build, tracked in issue #926. The 30-day window on AWS adds whatever runs still survive. A study that wants a MOGREPS-UK ensemble mean for the last 3 months can use Open-Meteo's stitched mean, but cannot recompute that mean from members.
A MOGREPS-UK run holds 3 members, and the Met Office's 18-member MOGREPS-UK ensemble is six hourly runs lagged together. Porson et al. (2020) describe it as "an 18-member ensemble ... created by running three members every hour and time-lagging these over a 6 hr window". The global MOGREPS-G has 18 members in each run, so its members all share one run age, at 20 km resolution and 6-hourly updates against MOGREPS-UK's 2.2 km and hourly updates. Members from different lagged runs differ in age by up to 5 hours, so they are not exchangeable the way the members of one run are. A mean or spread built from lagged runs therefore needs three things. The build has to decide how to weight members of different ages. It has to keep each member's run age (the run's initialisation time) beside the member. It must never treat the 3 members of a single run as a full ensemble, because a mean of 3 members is noisy and a spread from 3 members rests on 2 degrees of freedom. The ensemble-means study records what Open-Meteo's source code does.
What we learnt about MOGREPS-Global on 2026-09-27
The anonymous bucket met-office-global-ensemble-model-data carries only the full global grid,
not a pre-cropped UK subset. Every file under its global-ensemble/YYYY/MM/DD/THHMMZ/ prefixes
covers the whole world on a 960-by-1280-point regular latitude-longitude grid at 20 km spacing
(confirmed from the files' own mosg__grid_domain=global attribute), so an archive built from this
bucket crops to Great Britain on fetch, the same way it already crops the other archived products
from their native grids.
A run has 18 members, one file per variable per lead time holding every member, and reaches 246 hours. The bucket runs 4 times a day at 00:00, 06:00, 12:00 and 18:00 UTC. Most surface fields — including all four shortwave fields and 10 m wind — publish hourly to 132 hours and then 3-hourly to 246 hours (171 steps). The two height-level wind fields publish hourly only to 54 hours before switching to 3-hourly (119 steps), a shorter hourly window than the other fields. Each object expires 30 days after it is written, the same retention as MOGREPS-UK.
The bucket carries four shortwave fields and both 10 m and 100 m wind, one field further than
MOGREPS-UK's three shortwave components. radiation_flux_in_shortwave_total_downward_at_surface,
..._direct_downward_at_surface, and ..._diffuse_downward_at_surface match MOGREPS-UK's three;
radiation_flux_in_shortwave_net_at_surface (its file name carries no _downward segment) has no
MOGREPS-UK equivalent. wind_speed_on_height_levels and wind_direction_on_height_levels list 32
height levels including exactly 100 m, alongside wind_speed_at_10m and wind_direction_at_10m.
The deprecated registry.opendata.aws/mogreps/ listing is still readable, but its coverage ends
nearly three years before NGED's power data begins, so it does not extend either archive
backwards. The listing points to two further anonymous buckets, s3://mogreps-uk and
s3://mogreps-g, both still readable by anonymous S3 request despite the registry page marking the
listing itself as deprecated. s3://mogreps-uk holds runs from 2013-01-01 to 2016-12-31;
s3://mogreps-g holds runs from 2016-01-01 to 2016-12-31 (files at the bucket root, one per member
per lead time, named prods_op_mogreps-{uk,g}_YYYYMMDD_HH_00_LLL.nc). NGED's power telemetry starts
in late 2019, and neither current rolling bucket keeps more than about 30 days, so the gap between
2017-01-01 and roughly 30 days ago is covered by neither the deprecated buckets nor the live ones —
it would need a different source, such as the Met Office directly or CEDA, unverified. The
deprecated buckets also carry a different licence, "Non-Commercial Government Licence" for research
use, rather than the live MOGREPS-UK and MOGREPS-Global buckets' CC BY-SA 4.0, worth checking before
any use beyond research.
What we learnt about Met Office IMPROVER on 2026-09-26
The Met Office publishes its IMPROVER post-processing system's output on AWS as the Blended
Probabilistic Forecast (BPF), and the UK gridded buckets carry no irradiance. The BPF is in the
AWS Open Data programme in eu-west-2, as NetCDF under CC BY-SA 4.0, with a
percentiles bucket and a
probabilities bucket on a
2 km UK grid. Lead times are hourly to 120 hours and then 3-hourly to 186 hours. The registry says
the percentiles are updated "4 times each day", while the listing for 2026-09-15 held 94 blend-time
prefixes, about one every 15 minutes. Each object expires after 30 days. In the percentiles bucket,
the 44 variables listed by file name on 2026-09-15 include total cloud amount, low cloud amount, and
the UV index, and no downward shortwave, direct, diffuse, or sunshine-duration field. We inferred
the probabilities bucket's variables from the percentiles bucket's, and did not inspect the spot or
global buckets.
The UK gridded buckets carry wind at 10 m only, so it cannot serve either purpose that the
weather-product studies score. The wind fields are wind_speed_at_10m, wind_direction_at_10m,
and the 1-hour and 3-hour maximum gust at 10 m. No 100 m wind is listed in the percentiles bucket,
and the same caveat about the other buckets applies. Cloud cover is a weak substitute for the direct
and diffuse shortwave that the PV forward model needs.
The BPF is a calibrated blend, so it cannot stand in for MOGREPS-UK members in the ensemble-means comparison. Roberts et al. (2023) describe IMPROVER as blending probabilities rather than physical values, with model weights that represent each model's relative skill for precipitation, temperature, wind speed and direction, cloud cover, and visibility, and with a radar nowcast added for precipitation. The paper names no irradiance variable. The variable list and the file names hold percentiles and probabilities and no member index, so the UK gridded buckets have no raw members from which to compute a mean.
Recording the BPF whole would take 719 to 807 GB a day per bucket. One day (2026-09-15) held about 807 GB in the percentiles bucket and 719 GB in the probabilities bucket, for the whole grid. A useful field set (cloud, screen temperature, 10 m wind and gust, precipitation rate, visibility, humidity, and pressure) was 279 GB in the percentiles bucket. We estimate, from the bounding box, that Great Britain is about 22% of the grid, which gives about 60 GB a day cropped to Great Britain for that field set. Keeping one blend every 6 hours would be about 1 TB a year, also an estimate. The bucket holds 30 days, so a longer archive cannot be back-filled. In the searches behind issue #801, we found no archive of MOGREPS-UK, and we did not verify whether one exists for the BPF.
The research recommends against archiving the BPF for solar and wind. A small forward recorder is worth considering if a study wants the operational blend as a benchmark. See #801 for where such a recorder would be tracked.
The IMPROVER paper states that equal weights were used across time-lagged runs at the time of
writing (2023), although the open-source code has options to weight runs by age. Roberts et al.
say time-lagging is essential for MOGREPS-UK, which was designed as a time-lagged ensemble of
several runs of 3 members each hour, and that IMPROVER also time-lags UKV and MOGREPS-G. They say
options exist for applying different weights to each forecast length, "although at present, equal
weighting is used". The paper was published in March 2023, and we have not checked whether the
operational weights have changed since. In the code at commit
acf4ab6,
the weights can come from four sources. A dictionary gives piecewise-linear weights along a
coordinate such as lead time. A default linear rule runs between a start value and an end value. A
non-linear rule sets the weight of the i-th cycle to cval**i and can order the cycles so that the
newest is heaviest. A triangular rule is the fourth. The utility that merges lagged runs into one
ensemble only pools the members, without weighting them by age, and the repository's own
cycle-blending command line uses equal weights. The ensemble-means question of how to weight
members of different ages therefore has a published operational answer of equal weights, as of 2023.
ECMWF has published no plan to open a direct beam or hourly ensemble steps
Asked in July 2025 whether the open-data parameter list would grow, ECMWF said it would not grow
during the transition to open data. ECMWF staff
replied that they
were "not planning to expand the existing parameter dataset while we make the transition", and would
"review the parameters themselves and potentially expand in the coming years" — naming no parameter
and no date. Searching ECMWF's open-data catalogue
page, its news archive, its user forum, and
the ecmwf/ecmwf-opendata client repository turned up fdir, cdir, and dsrp nowhere as a
planned addition.
The open-data parameter list is not frozen, though. ECMWF
announced in December 2025
that total cloud cover, snow depth, and snowfall had been added to the IFS open dataset, and all
three are in the feed today. A request for a radiation parameter is therefore a request of a kind
ECMWF granted recently, rather than one the feed's design rules out. Asking is invited, too: the
same July 2025 reply says ECMWF are "happy to take suggestions and we keep a list of requests for
the open data", and when a user asked for fdir among the AIFS outputs in June 2025, ECMWF
replied that they would pass the request
to the AIFS developers — a request logged, not a plan.
The free feed's ensemble steps are 3-hourly to 144 hours, and the one dated commitment to widen the free feed is about grid spacing rather than steps. ECMWF's announcement of 1 October 2025, opening the whole Real-time Catalogue, says the free subset is published "at 25 km resolution" and that "later in 2026, the free and open subset will be extended to include our 9 km resolution forecasts with a 2-hour latency". The hourly steps the full catalogue carries out to 90 hours appear neither there nor anywhere else we searched. Hourly steps would be worth having for solar, because the coarser the step, the flatter and later the reconstructed solar day.
Removing the licence fee brought neither the direct beam nor a finer step to the free feed. The
October 2025 change made ECMWF's whole Real-time Catalogue open, and the free feed has gained
parameters since, but the open-data catalogue page, updated for IFS Cycle 50r1 on 13 May 2026, still
lists five radiation parameters — ssrd, strd, ssr, str, and ttr — and the same 3-hourly
step floor. Listing the index files of the 2026-09-19 00Z run agrees: 47
parameters at any one ensemble step, those same five radiation fields, and no step finer than
3 hours.
Two traps for whoever builds on ECMWF's direct beam
dsrp is the more convenient field to ask ECMWF for, because fdir is a horizontal-plane flux
and
dsrp is already direct normal irradiance. The ENS catalogue linked above carries three direct
fields: fdir (paramId 228021, total-sky direct at the surface), cdir (paramId 228022, the
clear-sky equivalent), and dsrp (paramId 47, direct solar radiation into a plane facing the sun).
Deriving direct normal irradiance from fdir means dividing by the cosine of the solar zenith
angle, which is numerically unstable at low sun, and the sun is low over GB for much of the year.
dsrp needs no division, so a request naming only fdir leaves behind the field that needs none.
ssrd − fdir is close to a diffuse pyranometer reading, but not equal to that reading.
ECMWF's
radiation
note
records that the model treats strongly forward-scattered radiation as unscattered, and that its
diffuse part includes the circumsolar radiation a shadow-band pyranometer excludes. The note puts
the correction on the measurement rather than on the model output: a diffuse measurement has to be
corrected for the shadow band before it is compared with ssrd − fdir. The note also warns
that these fluxes are accumulated over a period across which the solar zenith angle moves.
Converting an accumulated flux to an instantaneous pyranometer convention is therefore not
straightforward either.
ERA5: which access route
The leading candidate is the CDS's own analysis-ready Zarr store, but two open questions need
answering before we commit. Since
2026-06-30
Copernicus publish ERA5 single levels (and ERA5-Land) as analysis-ready Zarr, opened straight from
xarray with a CDS API key and offered geo-chunked — long periods over a small area, which is
our access pattern — as well as time-chunked. Neither of the two open questions is documented:
whether its subset of surface and wave variables carries the radiation we need (fdir above
all, since the direct component is why we prefer ERA5 to the ENS feed here; further parameters are
added on request), and whether it serves ERA5T or only final ERA5, since near-real-time is half
of why we chose ERA5 over CERRA. The Zarr store is also explicitly a beta service, and the CDS
reserve the right to withdraw access to protect Data Store performance.
Three fallbacks, in order. ARCO-ERA5 is a public
Google Cloud Zarr carrying ERA5T at about a week's lag — verify freshness via its
valid_time_stop_era5t / last_updated metadata. Earthmover
Icechunk-ERA5 is on AWS and updates daily, but is
paid; its free tier lags 3 months. The plain CDS API reaches about 5 days behind real time but
is not analysis-ready. Separately, a precomputed mean climatology for the weather-abnormality
feature is available from
WeatherBench2 at gs://weatherbench2/datasets/era5-hourly-climatology/.
Why ERA5 describes past sunshine and wind worse than most current weather products
ERA5 has four documented weaknesses: a weather model and assimilation system frozen in 2016, a 31 km grid, hourly sunshine that is a forecast rather than an analysis, and aerosol that is prescribed rather than observed. Neither the solar study nor the wind study measured how much each weakness contributes to ERA5's error at the study farms. The weaknesses come from ECMWF's own descriptions of ERA5 and from published validations.
ERA5 runs a weather model frozen in 2016, 10 releases older than the one ERA6 is built on. A reanalysis re-runs one weather model over past decades and corrects each hour towards the observations recorded then; that correcting step is data assimilation. ECMWF numbers each release of its Integrated Forecasting System (IFS) as a cycle, and ERA5 is produced with cycle 41r2, the version ECMWF used for its operational forecasts in 2016 (ERA5 documentation). The freeze is deliberate: a reanalysis is built to be consistent over decades, so ERA5 applies the same model physics, grid, and assimilation to 1940 as to last week. The operational IFS then moved through 10 cycles to cycle 49r2, the cycle ERA6 runs on (Copernicus announcement).
ERA5's 2016 assimilation system is unlikely to place cloud from satellite images, which CAMS and UKV both use. ERA5 keeps absorbing current observations, about 24 million a day by the end of 2018 (ECMWF Newsletter 159), but only as far as the 2016 assimilation system can use them. In 2019 ECMWF reported that infrared radiances were not yet assimilated operationally in all-sky conditions, meaning with cloudy and clear scenes treated alike (ECMWF Newsletter 161). That newsletter describes instruments on polar-orbiting satellites, so the step from its statement to geostationary imagery is this page's inference, not ECMWF's. CAMS reads cloud from Meteosat images of the hour itself, and UKV assimilates satellite-derived cloud (see UKV assimilates satellite cloud).
ERA5's 31 km grid holds cloud only as a fraction of each grid cell. A cloud smaller than a 31 km cell has no position inside the cell, so ERA5 cannot say which farm in the cell the cloud shades. Validating daily irradiance at 41 Baseline Surface Radiation Network stations worldwide and 294 stations in Europe, Urraca et al. (2018) found that ERA5 overestimates irradiance under cloud and slightly underestimates it under clear skies. The authors attribute that pattern to ERA5's poor handling of cloud, and judge ERA5's 31 km grid too coarse for places where surface irradiance varies strongly, such as coasts and mountains.
ERA5's hourly sunshine is a forecast up to 12 hours old. ERA5's hourly surface radiation is not an analysis: ERA5 takes it from short forecasts started at 06 and 18 UTC, at steps of 1 to 12 hours (ERA5 documentation). ERA5's hourly wind is an analysis, so the forecast age applies to sunshine and not to wind.
ERA5's aerosol is prescribed, never taken from observations of that day's haze. Aerosol matters for sunshine because aerosol sets how much sunlight reaches the ground and how that sunlight divides between the direct beam and the diffuse sky. Cycle 41r2 reads tropospheric aerosol from the monthly climatology of Tegen et al. (1997) (IFS documentation, cycle 41r2, part IV). ERA5 takes its tropospheric sulphate, and the stratospheric sulphate that volcanic eruptions leave, from forcing data prepared for the Coupled Model Intercomparison Project Phase 5 (ECMWF Newsletter 159, ECMWF Newsletter 174). ERA5's aerosol therefore varies by month and from year to year, but not with the day's haze. CAMS's irradiance takes aerosol from CAMS's own reanalysis and global forecasting system (CAMS radiation documentation), and UKV carries a fixed climatology (see UKV assimilates satellite cloud).
The published validations of ERA5's wind cited here come from sites unlike the wind study's farms, which are onshore in flat Lincolnshire. Offshore, ERA5 underestimates strong wind speeds. Gandoin and Garza (2024) trace the bias to ERA5's surface drag formulation and its dependence on sea state, worst for short fetches (wind that has crossed only a short stretch of open water) over shallow seas such as the North Sea. At the IJmuiden mast they measure an underestimate of almost 10% for the largest wind speeds. Against Doppler lidar at heights of 100 to 500 m, Cheynet et al. (2025) found ERA5 and the 3 km Norwegian hindcast NORA3 similar offshore, and NORA3 better than ERA5 at two coastal sites and one complex-terrain site in Norway.
CAMS: use the point API, not the gridded product
Two CAMS products exist, and only the point time-series product is current. The gridded product would suit the H3 pipeline — 0.1°, 15-minute, monthly netCDF — but it lags years behind, and version 4.6 (rev2) is the only version that reaches 2024:
| Version | Years available |
|---|---|
| 4.5 | 2005–2022 |
| 4.6 | 2005–2023 |
| 4.6 (rev2) | 2005–2024 |
A grid that stops in 2024 is disqualifying for capacity estimation, because the domestic solar fleet the estimate has to track has kept growing since. That table was read from the Atmosphere Data Store catalogue API on 2026-09-09, and a user who asked for April 2025 onward in May 2026 was given no release date and pointed at the point product instead.
The point time-series
product runs to
yesterday, and takes one latitude and longitude per request. That is annoying rather than
disqualifying: one request covers a location over a whole date range, so the count scales with sites
rather than with days. The v1 trial area needs at most 32 requests, 6 of them
for the solar farms, against a limit of 500 requests per day. The daily cap binds long before the
wait does, at least at the sizes tested: a 14-day request at a 15-minute step returned in 27 seconds
on 2026-09-21. A multi-year request has not been timed. Ask for observed_cloud rather than
clear: the all-sky response carries the clear-sky columns (GHIc, BHIc, DHIc, BNIc)
alongside the all-sky ones, so one request returns both, and their ratio is the clear-sky index that
conditions the capacity fit and the published estimates of CAMS's own error.
No intraday correction can rest on CAMS, whatever the accuracy of its irradiance. A request naming today is rejected outright: probing the retrieval API on 2026-09-21 returned HTTP 400 for that same day, and a complete set of values for 2026-09-20. The freshest value on offer is yesterday's last interval, which the period-ending convention below timestamps at 00:00 UTC today. A forecast job running at 09:00 UTC therefore gets nothing at all about the day it is forecasting. The most recent daylight irradiance that job can reach dates from yesterday's sunset — between roughly 15:45 UTC midwinter and 20:35 UTC midsummer across NGED's licence areas.
The latency is 1 day, not the 2 days some third-party documentation still gives. The CAMS
Radiation Service halved the latency in February
2026.
The same change raised the daily cap to the 500 requests above. The camsRad
vignette still
gives the coverage as "up to 2 days ago", so check any latency figure taken from outside the
Atmosphere Data Store against the request form itself.
Great Britain sits inside the Meteosat Second Generation field of view that bounds the all-sky product, with the same low-winter-sun degradation SARAH-3 documents. Meteosat Third Generation is not yet in the CAMS processing chain. Depending on a service still built on the older satellite is a supply risk.
Three traps in the point API each fail silently.
- Set
time_referencetouniversal_time. The request form also offers true solar time, which differs from UTC by the site's longitude plus the equation of time. Across Great Britain that offset runs from roughly −38 to +24 minutes, varying by site and by time of year, so it exceeds a half-hour step at western sites in winter and looks exactly like a retrieval bias. - Values are irradiation in Wh/m² accumulated over the step, not irradiance in W/m². ECMWF timestamp each value at the end of its integration period, matching NGED's period-ending convention above.
- CAMS recomputes each request on the fly against the latest software release and the latest aerosol and cloud inputs, so the same timestamp can return a different value next year. Snapshot each fetch into Delta and treat the snapshot as the source of truth, or experiments stop being reproducible.
What comparing weather products on the trial area's solar farms found
The satellite retrieval beat the reanalysis by 4.29 points of mean absolute error on the six
metered solar farms, which is the largest effect anything in that experiment varied. On the
124,849 hours both products cover, CAMS cut an XGBoost forecast's error from 9.66% to 5.37% of P99
output — the 99th percentile of each site's own metered output, which every figure there is
normalised by — and a fitted five-parameter physical model's from 10.03% to 6.20%. The largest
contrast from changing which beam/diffuse split the model saw was 0.126 points, and changing the
model family moved 1.05. Which product feeds the model dominates both. The write-up is Does a
weather product's beam/diffuse split help a PV forecast?; the
code sits in studies/beam_diffuse_split/.
Scoring eight products on one common set of hours puts the two satellite retrievals far ahead of every weather model. On 76,727 generator-hours from December 2022 to August 2026, CAMS scores 5.09% of capacity and SARAH-3 5.49%. Among the weather models and reanalyses, the German weather service's ICON-D2 scores 7.76%, ICON-EU 8.39%, ICON global 8.48%, its reanalysis ICON-DREAM-EU 8.77%, the Met Office's UKV 8.86% as Open-Meteo serves its hourly value, and ERA5 9.08%. ICON-D2's advantage shrinks within hours of each run, and ICON-EU no longer beats UKV once UKV's hour is rebuilt from its own snapshots. Four more Open-Meteo models are scored on a shorter row set from November 2024. The write-up, with what each offline consumer should read, is Which weather product best describes past sunshine?.
Figures measured on different row sets do not compose into a ranking. ERA5 scores 9.08% on the eight-product row set and 8.87% on the shorter row set that adds four more Open-Meteo models: the same product and the same generators, because restricting to hours every product covers changes which hours are kept. Open-Meteo's hourly UKV beats ERA5 across the whole record by 0.22 points [0.06, 0.39], and by 0.14 points since August 2024 [−0.04, +0.35], the second of which is not statistically significant at the 5% level.
CAMS infers cloud from Meteosat at the hour in question, whereas the weather models simulate it. So a retrieval of an hour that has already happened starts from the cloud field the others have to predict.
Three limits bound how far that carries. UKV differs from ERA5 in aerosol treatment as well as in resolution, so neither ordering is a clean resolution contrast. Open-Meteo's archive stitches the first hours of each successive run (the survey compares Open-Meteo's archives), so a product's effective lead follows its run frequency: hourly UKV is the T+0 analysis, while 3-hourly ICON-D2 carries a lead of 1 to 3 hours, measured against the German weather service's own files. ICON-D2 therefore beats UKV while forecasting further ahead than it, and the comparison is not analysis against analysis. And CAMS is a retrieval rather than a model, so its lead is nil and its win is partly a win for observing cloud rather than simulating it. Every measurement is of these eight products on this fleet, and none has been shown to hold for every product at those resolutions.
ICON-D2 reaches only the eastern half of NGED's licence area, so its score is not a licence-wide result. Probing the Open-Meteo archive along a west-to-east line puts the model's western boundary near 2.5°W: Bristol, Exeter, Cardiff, Swansea, and Truro return no data, while Birmingham and Nottingham are covered. The whole of South West England and South Wales therefore sit outside it, and every metered site in this comparison sits inside it, so nothing here says how ICON-D2 would perform in the west. A limited-area model from a neighbouring country can be a component of a blend over part of the licence area, and cannot be the single source feeding all of it.
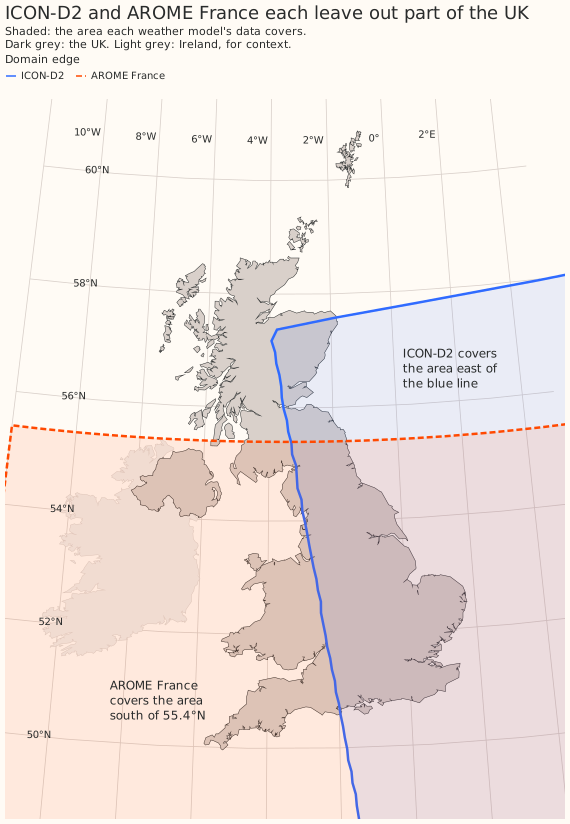
Two limited-area weather models cover only part of the UK, and every other weather product this
page names covers all of it. ICON-D2 misses South West England, Wales, the western edge of
the Midlands and of North West England, the Isle of Man, Northern Ireland, and Scotland west of
Edinburgh and north of about 57.5°N, including Orkney and Shetland. Météo-France's AROME France,
listed on the weather products survey, misses
everything north of 55.4°N: all of Scotland except its southern fringe, and the northern tip of
Northumberland. AROME France does cover Northern Ireland, whose northernmost point is at 55.3°N.
The ICON-D2 outline is traced from the valid-data mask of one file the German weather service
publishes, the 2 m temperature from the 00 UTC run of 23 September 2026. That outline's western
edge at 53.2°N sits at 2.6°W, which agrees with Open-Meteo returning no data west of about 2.5°W.
The AROME France outline is the plain rectangle in the grid description Open-Meteo publishes, and
Open-Meteo's API confirms the northern edge by returning data at 55.3°N and none at 55.5°N. The
map is drawn by studies/beam_diffuse_split/weather_product_domains.py.
CAMS's own reliability flag is worth acting on, and dropping the flagged hours raises a P99-normalised error even though it improves the data. The service flagged 17.9% of the daylight hours it delivered as less than 90% reliable. Those hours are much darker than the ones kept — 33 W m⁻² of global irradiance against 285, and 3.5% of P99 output against 36.1% — so removing them removes hours where every model is nearly right, and the remaining mean error rises mechanically. Any comparison that drops them on one source and not on another is comparing two row sets rather than two products; restrict to the shared hours first.
The beam field CAMS publishes is worth having and the one ERA5 publishes is not. On the 5 km retrieval, giving a model the product's own split rather than running a separation model locally cut error by about 1.5% relative. On the 31 km reanalysis it added nothing detectable. Whether the retrieval's beam field is worth paying for depends on what a supplier charges for it, which that experiment does not know.
Met Office weather-station observations (MIDAS Open)
The project ingests no weather-station observations, and the studies read the Met Office's MIDAS Open only to test whether a nearby station stands in for a gridded product. MIDAS Open is released once a year, and its current release ends on 2025-12-31. MIDAS Open can therefore feed offline work but not the live forecast. On sunshine, a nearby station's irradiance scored worse than CAMS and better than ERA5. On wind, a nearby anemometer scored worse than ERA5's 10 m wind. Adding a station's observations to a gridded product (CAMS on sunshine, UKV on wind) lowered that product's error, so neither result rules a station out as an extra input. The licence, the stations fetched, the variables, the results, and the limits of both studies are in the weather products survey.
UKV assimilates satellite cloud, and carries a fixed aerosol climatology
UKV's radiation scheme sees no time-varying aerosol, which matters because aerosol sets how sunlight divides between the direct beam and the diffuse sky. The regional configuration's radiation uses a fixed five-species climatology, unchanged from RAL1 through the RAL3 package that went operational at PS47 on 2026-01-21: Bush et al. (2020) describes the climatology, and Bush et al. (2025) records that no radiation parameters changed between RAL2 and RAL3. UKV's only advected aerosol quantity is the Murk tracer of Clark et al. (2008), which diagnoses visibility and does not reach the radiation calculation. CAMS is aerosol-informed by construction. ERA5's aerosol is prescribed, a monthly climatology plus sulphate forcing, with nothing assimilated (see Why ERA5 describes past sunshine and wind worse than most current weather products). So any skill ERA5's split shows could come from cloud or, weakly, from prescribed aerosol that varies by month and year but not with the day's haze, and any skill UKV's split shows can only be cloud-sourced, where CAMS's could be either.
UKV's 4D-Var assimilates a large volume of satellite-derived cloud, so at short lead times the model is partly a retrieval. Satellite-derived cloud fraction was the single largest observation type by count in UKV's 2013 observation table, at 650,000 a day against 39,000 for SEVIRI radiances (Tubbs and Kelly (2013)), entering the humidity field as a pseudo-observation by the mechanism of Renshaw and Francis (2011). The PS43 release notes confirm the stream was operational and being refined in December 2019, and the PS47 notes name only latent heat nudging and the adaptive vertical grid as assimilation methods removed. No document from 2020 onwards was found positively re-confirming the satellite cloud stream, and whether surface solar irradiance is assimilated anywhere in the Met Office's systems could not be established. A UKV analysis and a satellite product are therefore partly downstream of the same geostationary satellite, so a contrast between the two weakens at short lead and recovers as the model's own physics overwrites the initial cloud field.
Open-Meteo's UKV archive is the T+0 analysis, and half of it is backfill
Open-Meteo mirrors UKV from the Met Office's own AWS bucket, ingesting every hourly run about four hours late. A later run overwrites an earlier one for the same valid time, so the archive holds the T+0 analysis rather than a forecast at any lead. Sampled at five instants either side of PS47, the nearest grid cell in the Met Office's own file agrees with the served snapshot to between 0.11 and 0.55 W m⁻², where every other lead sits tens to hundreds of W m⁻² away. An archive of analyses is the right object to compare against a reanalysis or a retrieval and the wrong one to read as forecast skill.
Over half the archive predates the ingest that produced the rest. Open-Meteo's UKV downloader was created on 2024-08-12, and the archive claims to start on 2022-03-01, so the 29 months between were backfilled from a source Open-Meteo does not name. The AWS bucket's rolling two-year window reached back only to about August 2022 on the day the downloader landed, so an AWS backfill does not account for the stated start either, and the window has since rolled past all of it. The era that can be checked against the Met Office's files is essentially the era Open-Meteo ingested live, and the earlier half cannot be checked against anything.
A Met Office upgrade moved how much UKV's published split improves the forecast, by more than the backfill boundary does. In the beam/diffuse split experiment, the gain from UKV's direct-beam share is five and a half times larger over the 8 months after Parallel Suite 47 became operational on 2026-01-21 than over the 47 months before. Neither other source steps over those same months: the satellite source's contrast moved by about a third, from −0.100 to −0.068 percentage points, and the reanalysis stayed null in both eras. UKV's global irradiance went the other way, sitting about 1 percentage point worse against the reanalysis from the same date.
One upgrade moved this product's value by a factor of five and a half, so a production ingest of UKV should score continuously rather than trust a figure measured once, and should not assume that one era of UKV stands in for another.
Three mechanical facts about the served columns, each of which fails silently if assumed wrong.
- Only global and direct short-wave are ingested; diffuse is served as their difference. The Met Office publishes its own diffuse field and Open-Meteo does not read it, so the served diffuse carries no information the other two columns lack.
- The default hourly column is a backward-looking mean over the hour ending at its label, which
matches the period-ending convention used everywhere else in this project. UKV publishes radiation
as an instantaneous snapshot, and Open-Meteo divides that snapshot by the ratio of the
instantaneous cosine of the solar zenith angle to its mean over the preceding hour. Asking for the
_instantsuffix multiplies the ratio back to recover the snapshot, which lands half an hour later than the hour's centre. - That conversion is skipped where the ratio falls below 0.05, near sunrise and sunset, so the round trip between the two columns does not hold at very low sun.
NWP model upgrades since 2019
The weather models the project reads have changed many times since 2019, and many of those changes alter irradiance, cloud, or wind. ECMWF changed the IFS cycle behind ECMWF ENS seven times between June 2019 and May 2026. The German weather service (DWD) changed ICON in ways that touch cloud, radiation, or wind on 16 dates between July 2019 and September 2026, counting the introduction of ICON-D2. The Met Office changed UKV's physics package twice. A model trained on one version of a weather model and run on the next meets inputs whose relationship to power has moved. After the Met Office's PS47 upgrade, the error reduction from giving a model UKV's published direct-beam share grew five and a half times larger, comparing the 8 months after the upgrade with the 47 months before. How the live service plans to handle an upgrade is in Live service → NWP model upgrades.
The full list is nwp-model-upgrades.csv, 98 changes under 19
product labels, each checked against the producer's own text on 2026-09-23. The verified column
reads yes where the check confirmed the row as written, corrected where the check changed it, and
unverified where no producer text could be found. The note column says what the check found. The
list also covers products the project neither reads nor evaluates: NOAA's GFS and GEFS,
Météo-France's ARPEGE and AROME, KNMI's HARMONIE-AROME, MET Norway's NORA3, and CERRA's publication
history.
The table below keeps only the verified changes that alter irradiance, cloud, or wind over Great Britain, in the weather models the project reads or is evaluating, and in the two archives the studies read them through. It leaves out changes confined to DWD's ICON-EPS ensemble, which the project does not read. ERA5 has no rows, because ECMWF froze ERA5 at IFS cycle 41r2 for the whole record. ERA5's near-real-time stream, ERA5T, has correction periods in which it differs from the final ERA5, but the check found no correction period that touches irradiance or wind. Between PS43 and PS47 the check found no UKV physics change. UKV was still on the RAL2-M physics after PS45 in May 2022, PS46 in May 2025 was a move to a new supercomputer with no science change intended, and no date or content for PS44 could be found.
| Takes effect | Model | What changed | Source |
|---|---|---|---|
| 2019-06-11 06 UTC | ECMWF IFS 46r1 | Longwave scattering switched on in the radiation scheme; convection changes; new 200 m wind output | ECMWF |
| 2020-06-30 06 UTC | ECMWF IFS 47r1 | Revised shortwave albedo of land, snow, and sea ice; updated total solar irradiance; less ocean drag at high wind speeds | ECMWF |
| 2021-05-11 06 UTC | ECMWF IFS 47r2 | ENS vertical levels raised from 91 to 137 | ECMWF |
| 2021-10-12 06 UTC | ECMWF IFS 47r3 | New moist physics: cloud vertical overlap, sub-grid cloud, and gustiness revised; resolution unchanged | ECMWF |
| 2023-06-27 06 UTC | ECMWF IFS 48r1 | ENS grid refined from about 18 km to about 9 km | ECMWF |
| 2024-11-12 06 UTC | ECMWF IFS 49r1 | 2 m temperature observations assimilated; the SPP stochastic scheme replaces SPPT in the ensemble; ECMWF reports better 10 m wind | ECMWF |
| 2026-05-12 06 UTC | ECMWF IFS 50r1 | SPP revised to reduce excessive 10 m wind spread; aerosol climatology updated | ECMWF |
| 2025-02-25 06 UTC | ECMWF AIFS Single v1 | First operational AIFS Single, on a grid of about 32 km, with ssrd, strd, and 100 m wind among its outputs |
ECMWF |
| 2025-07-01 06 UTC | ECMWF AIFS ENS v1 | First operational AIFS ENS: 51 members on a grid of about 31 km, with ssrd and 100 m wind among its outputs |
ECMWF |
| 2025-08-27 06 UTC | ECMWF AIFS Single v1.1 | Soil-moisture loss weight reduced by a factor of 100 to remove spurious point-rainfall artefacts; an earlier attempt on 2025-07-31 was reverted on 2025-08-01 | ECMWF |
| 2026-05-12 06 UTC | ECMWF AIFS Single v2 | New wave, snow-cover, and 10 hPa outputs; fine-tuned on operational and experimental 50r1 analyses | ECMWF |
| 2026-05-12 06 UTC | ECMWF AIFS ENS v2 | Multi-scale training loss and stricter variable bounds; fine-tuned on 2018 to 2024 data plus 50r1 data | ECMWF |
| 2019-07-30 06 UTC | DWD ICON 2.5.0 | Revised cloud-cover scheme, aimed at better cloud and radiation forecasts | DWD |
| 2019-10-22 06 UTC | DWD ICON 2.5.1 | Cloud-cover scheme retuned; DWD reports global radiation error down 1–2% and daytime radiation bias down 3–4 W m⁻² | DWD |
| 2020-05-19 09 UTC | DWD ICON | Aeolus satellite wind observations assimilated | DWD |
| 2021-02-10 09 UTC | DWD ICON-D2 | ICON-D2 replaces COSMO-D2 as DWD's convection-permitting regional model | DWD |
| 2021-04-14 06 UTC | DWD ICON 2.6.2 | ecRad replaces RRTM as the radiation scheme, with stochastic cloud overlap, in ICON global, ICON-EU, and ICON-D2 (09 UTC) | DWD |
| 2021-09-08 | DWD ICON 2.6.3 | Sub-grid orography scheme retuned; small improvement in northern-hemisphere winter wind | DWD |
| 2022-11-23 06 UTC | DWD ICON | Vertical levels raised from 90 to 120 in ICON global and from 60 to 74 in ICON-EU; new orography; adaptive surface friction; DWD reports a smaller positive wind bias at turbine height | DWD |
| 2023-03-15 06 UTC | DWD ICON | 10 m wind assimilation extended; shallow convection switched off in stable boundary layers, improving stratocumulus and the solar radiation bias; ICON global and ICON-D2 (09 UTC) | DWD |
| 2023-11-28 06 UTC | DWD ICON 2.6.6 | Sub-grid orography and turbulence retuned for winter; the cloud-cover scheme gains an inversion diagnostic to improve stratocumulus | DWD |
| 2024-01-24 | DWD ICON-D2 | 10 m wind assimilation and adaptive surface friction extended | DWD |
| 2024-07-09 09 UTC | DWD ICON-D2 | Gust parameterisation revised | DWD |
| 2024-12-04 06 UTC | DWD ICON | Adaptive parameter tuning extended; snow cover revised in the surface transfer, which can shift near-surface wind; ICON global and ICON-D2 (09 UTC) | DWD |
| 2025-07-23 06 UTC | DWD ICON | Dissipative heating and warm-layer ocean parameterisations added in every ICON configuration | DWD |
| 2025-09-24 06 UTC | DWD ICON | Inversion-cloud scheme extended from stratocumulus to stratus, for winter fog and low cloud, and switched on in ICON-D2 | DWD |
| 2026-02-18 09 UTC | DWD ICON-D2 | New output field for 10 m wind corrected for sub-grid orography; adaptive surface friction restricted | DWD |
| 2026-09-02 12 UTC | DWD ICON | A prognostic aerosol scheme replaces the Tegen climatology for non-dust aerosol in ICON global and ICON-EU; in DWD's tests over central Europe, global radiation increases significantly | DWD |
| 2026-10-06 06 UTC, announced | DWD ICON-EU | ICON-EU domain slightly enlarged, mainly to the south | DWD |
| 2019-12-04 | Met Office PS43 | UKV and MOGREPS-UK move to the RAL2-M physics: mixed-phase ice cloud fraction, sub-grid turbulence, and lying snow | Met Office authors, GMD 2023 |
| 2026-01-21 | Met Office PS47 | UKV and MOGREPS-UK move to the RAL3 physics: double-moment microphysics (CASIM), a bimodal cloud scheme, and boundary-layer and land-surface updates | Met Office |
| 2021-06 | CAMS Radiation Service v4.0 | APOLLO_NG cloud detection replaces APOLLO | ECMWF |
| 2022-09 | CAMS Radiation Service v4.5 | New all-sky model, with the bias correction removed | ECMWF |
| 2023-07 | CAMS Radiation Service v4.6 | The McClear clear-sky model reads inputs from IFS cycle 48r1 from 2023-06-27; earlier data unchanged | ECMWF |
| 2023-07-04 | Open-Meteo v0.2.69 | Solar-radiation calculation improved, including direct normal irradiance | Open-Meteo |
| 2025-10-01 | Open-Meteo | Native 9 km IFS HRES served, with ECMWF's own direct radiation, after ECMWF opened its real-time catalogue. ECMWF's own news says the 9 km catalogue is planned for later in 2026, which conflicts with this date; the conflict is unresolved | Open-Meteo |
Date an upgrade by the first run it applies to, not by the day it was announced. ECMWF brings in each cycle at the 06 UTC run, so the 00 UTC run of the implementation day, which is the run the project ingests, is still on the old cycle. DWD publishes a notice 5 to 15 days before a change takes effect. The effective date is in each notice's title ("Gültigkeit ab") and in the PDF's file name, and the dates above are effective dates. A month-only date, such as the CAMS rows', means the producer published no day. Open-Meteo's dates are software releases, and the hosted service may deploy a change on a different day.
A CAMS version change may rewrite history, because the Radiation Service computes each request afresh. The changelog says that v4.6 left data before 2023-06-27 unchanged, and says nothing either way about v4.0 and v4.5. A series fetched before a version change and one fetched after it may therefore disagree over the same hours, which is one more reason to snapshot each fetch.
Two fields in Dynamical.org's ENS archive start part-way through it. The archive starts on 2024-04-01, but 10 m gust starts on 2024-11-13 and total cloud cover on 2025-11-21. Neither field is ingested today; a feature built on either would meet nulls across the early part of the record.