Roadmap
This roadmap outlines the planned order of development toward the v1.0 live forecast release (January 2027) and beyond. This page was last substantially revised July 2026, following a full codebase review and a reprioritisation (decided 2026-07-01) that made getting any forecast running on AWS the top priority over scientific-improvement work. That shipped as v0.1 in July 2026; the live service is now on v0.2 (deployed 13 August 2026), and work continues on the milestones below toward v1.0. Technical plans change as we learn more — treat this as a best-estimate, not a guarantee.
For how this page relates to GitHub issues,
docs/architecture/, and the rest of the docs — and which place to put new planning content — see the Documentation Guide.Status legend (used throughout these design docs): ✅ Implemented — exists in code today · 🚧 Planned — designed, not yet built · 🔬 Research — exploratory / v2.
Design documents
- Delivery tables — the five Delta Lake tables OCF delivers to NGED
(
power_forecast,power_forecast_warnings,asset_health_history,effective_capacity,substation_switching), with full field-level schemas. - Forecast building blocks — "normal" vs. "prevailing conditions" forecasts, sign conventions, and worked examples.
- Metrics & leaderboard — cross-fold validation protocol, evaluation metrics, horizon time-slices, and leaderboard grouping tags.
- Estimating the money a better forecast saves — the two £ leaderboard metrics (flexibility procurement and curtailment), the equal-risk method that avoids needing a price for a network breach, their limitations, and the open questions for NGED.
- Data sources — NGED power data + supporting files, network topology, and the weather datasets (ECMWF ENS, ERA5, CAMS), with the dated list of upgrades to each weather model.
- Live service — the AWS deployment: the
live_forecastsinference asset, the champion-model container, the costed AWS architecture options, production monitoring, and the handling of NWP model upgrades. - Handover to NGED — the operating model after the Network Innovation Allowance (NIA) project ends (the working assumption is that NGED runs the service on its own AWS account): the operator-contract design constraint, and the handover workstreams (runbooks, alert-on-absence, infra-as-code, confirming NGED's cloud and security standards, and game days).
- XGBoost improvements — the v0.5 experiment backlog: four effort tiers, ordered best bang-for-the-buck within each tier, targeting the 3–10 day user band.
- Extending the training history — using ERA5 to train on the power data that predates the ECMWF ENS archive: the era-confounding hazard that dictates the ingest's scope, the reconciliation and pooling variants, the COVID covariate, and why ERA5 scoring is a diagnostic rather than a promotion criterion.
- Engineering health — scientific-rigor tests and cleanup.
- Capacity estimation — the v0.7 head-to-head between candidate estimators of the time-varying effective capacity of metered generators: a convex (CVXPY) censored quantile-envelope estimator, a differentiable-physics variational estimator, and cheap baselines — the winner ships in v1.
- Net-demand disaggregation — the canonical v2 research arc: graph-structured disaggregation of net substation power into latent demand and DER generation, the convex dictionary baseline, MVA metering, prior art, and the novelty claims.
- Switching events — the canonical treatment of switching events and estimating latent demand under the normal running arrangement: the v0.6 unsupervised statistical detector and the v2 mixture models (the graph is a data structure).
Milestones
The milestone sections below show the order in which this work is planned. Each maps 1:1 to a GitHub epic issue.
v0.1 — "Naive" MVP (internal only)
Epic: #137 — deploy the
naive forecast on AWS. ✅ Shipped July 2026 (v0.1.0), superseded on AWS by v0.2 on 13 August
2026.
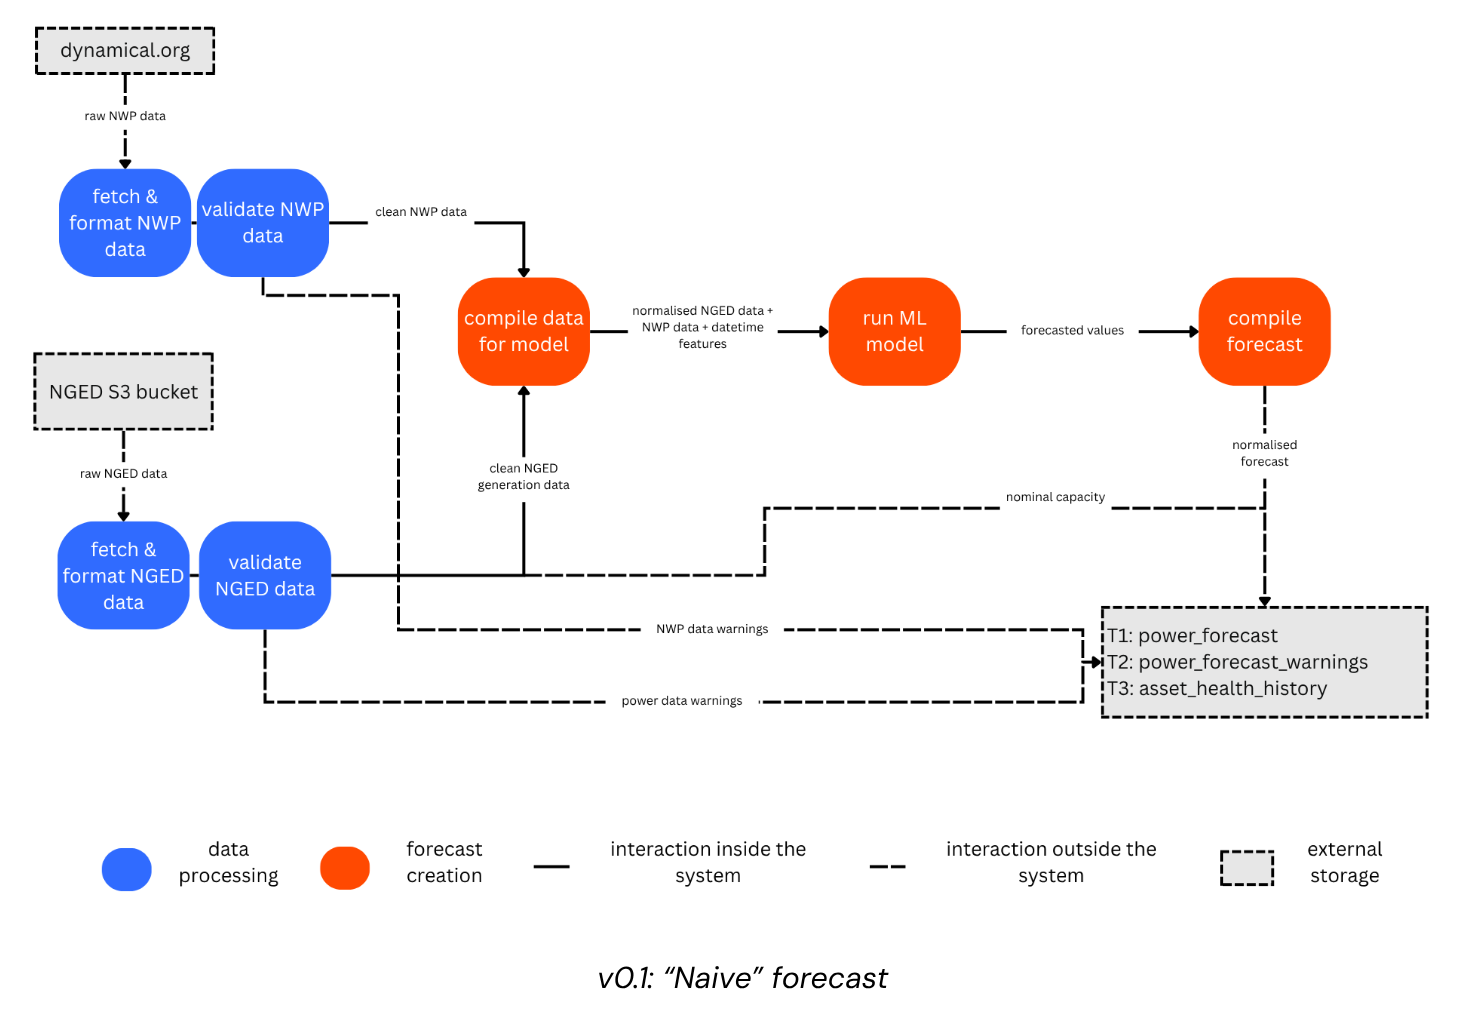
Goal: A simple XGBoost forecast that lets us test infrastructure end-to-end and establish a baseline. Intentionally does not detect switching events or estimate effective capacity — hence "naive" (assumes the grid is always in perfect health). The data pipeline, per-series XGBoost models, and CV leaderboard were already built; the remaining work was deployment, now running on AWS — see Live service.
v0.2 — Code Quality & Documentation
Epic: #138 — code quality,
reproducibility, and observability hardening. ✅ Shipped 13 August 2026 (v0.2.0) — running on
AWS.
- More unit tests, including feature-level lag-leakage and forecaster-level determinism tests ✅
(#62; exercised by
test_nullify_leaky_lags,test_engineer_features_weather_lag_leakage_preventionandtest_random_seed_makes_training_deterministic, alongside new package coverage fordynamical_data(#163) andgeo(#164)). The CV-windowing no-lookahead, leaderboard-fairness and fold-level determinism guardrail tests remain unwritten — see Engineering health - CI on GitHub (ruff + ty + pytest on every PR) ✅ (per-PR gate + nightly network tests; see Testing → Continuous integration)
- Improve documentation ✅ (#139)
- Verify daylight savings time handling is correct ✅
(#84;
test_apply_local_time_features_dst_transitionscovers both the spring-forward and fall-back transition instants) - Reproducibility stamping: git SHA + Delta table versions on every MLflow run ✅ (implemented in
ml_core.repro; every MLflow run carries the stamp) - Drop Hydra in favour of plain YAML + importlib + pydantic ✅ (
contracts.config_schemasowns the_target_round-trip; dropping the two dependencies also unpinnedantlr4-python3-runtime, which had been breaking Dagster's asset-selection strings) - Asset check on
live_forecastsreporting missed NWP runs at forecast time (#424) ✅ (live_forecasts_are_healthy: it also reads the slot's rows back off disk, so every production asset now has a check — including the one NGED consume) - Start the intervention log ✅ (started with the v0.1 AWS period; its measurement window opens at v1.0, but it cannot be reconstructed retrospectively, which is why it exists now)
v0.3 — Leaderboard / Performance Analysis
Epic: #6
- Implement the ML energy forecasting "leaderboard" (cross-fold validation metrics in MLflow), ready for systematic ML experimentation ✓ (CV assets added)
- Metrics: MBE, MAE, NMAE, RMSE, Pinball loss, PICP, interval width, CRPS, Spread-Skill Ratio — all ✅ (definitions in the evaluation-metrics reference; plan and remaining 🚧 items in Metrics & leaderboard)
- Time-slice filters: nowcasting (0–6 h), day-ahead (6–36 h), medium range (Day 2–7), extended range (Day 8–14), peak events (top 5%)
- Baseline forecasters (persistence + climatology) so leaderboard scores are interpretable
- Cost-savings metrics (£) — two figures per leaderboard row, for flexibility procurement and for curtailment, scored against manual review and against a perfect forecast; see Estimating the money a better forecast saves. Expected to be the metrics NGED read first, so they land early in this milestone.
- Production monitoring of the live service (
production_monitoringmetrics scope) - Failure-scenario evaluation — the evaluation machinery must precede the v0.5 experiments it is
meant to judge, or v0.5 picks a champion blind to how it behaves when inputs degrade:
- Canonical failure-scenario suite: named, versioned degradation transforms (#437) — see Scoring under failure scenarios
- Degradation smoke-tests in CI (#436)
- Score every leaderboard experiment under each scenario, against
manual_heuristic(#438)
- One-command rollback for
promoted_model(#440), plus the runbooks that pin down what "one command" means (#448)
v0.4 — Automatic Data Cleaning
Epic: #150
- Automatic cleaning of NGED's power data. Versions 0.1 to 0.3 do none: the models train on, and the live service forecasts from, uncleaned telemetry. What has been measured about the trial area's faults, including the one commissioning cut-off already established, is in cleaning the trial-area telemetry
power_forecast_warningsPhase 1 —STALE NWPandSTALE POWER, withwarning_source(#439)power_forecast_warningsPhase 2 — the meter-error warning types, which are this milestone's cleaning detections surfaced to NGED (#441)- The
asset_health_historytable — the historical view of the same detections (#442)
v0.5 — XGBoost Upgrades ("Quick Wins")
Epic: #145
Establish a strong XGBoost baseline before investing in capacity estimation and switching event detection.
The full experiment backlog — four effort tiers, ordered best bang-for-the-buck within each tier — is in XGBoost improvements.
This milestone also carries the ERA5 ingest (#143, moved here from v0.7) and the pre-training experiments it unlocks (#167) — see Extending the training history. Our power data reaches back to late 2019 while the ENS archive starts 2024-04-01, and Dynamical.org's ENS back-fill is not expected until ~November 2027, so ERA5 is how the seasonal experiments on this page get more than one winter to learn from. The Tier-1 and Tier-2 config wins do not wait for it.
This milestone also carries the quantile-ensemble pipeline (per-member quantile forecasts pooled into delivered percentiles — Phase D of Delivering the probabilistic metrics; theory in Probabilistic forecasting from NWP ensembles), which builds directly on the lead-time-feature and ensemble-member-training wins in that backlog.
It also carries the degradation half of the inherent-stability work, which is gated on that same quantile pipeline:
- Degradation-conditional interval calibration — conformal prediction per regime (#443), so the bands widen honestly when the inputs degrade rather than staying over-confident
- The weather-blind guarantee: outage-shaped training augmentation (#445), which is what makes "never worse than the manual heuristic" true rather than hopeful
- Clear-sky as the zero-data floor (#444), extending #168
- Make
live_forecastsdegrade rather than raise when NWP is absent (#446) — deliberately gated on the two items above, since degrading earlier would emit output no scenario has tested
Automated experimentation ("auto-research"):
Once the leaderboard (v0.3) is stable, we plan to drive hyperparameter and feature search with an LLM agent in the style of Karpathy's "auto-research": the agent programmatically registers experiments, materialises them, reads the MLflow leaderboard, and iterates — with no human in the loop and no Dagster UI in the path. (This may have to wait until v2).
The ML-assets architecture is designed to support this from day one (programmatic experiment registration, MLflow as a machine-readable leaderboard, a manual retirement job to prune the experiment catalogue). The one piece to add when we start is a machine-readable leaderboard: a thin, typed Python surface answering "fetch the aggregate leaderboard metrics for experiment X" and "rank every experiment by metric Y", so the agent reads results without scraping a UI. The visual leaderboard (#4) needs the same query underneath it, so writing that query as a reusable function rather than burying it in the chart script is what makes the agent's surface nearly free when we get there.
MLflow's own MCP server does not serve this need, so it is not a shortcut we can take instead. Its
tools are generated by capturing the stdout of a curated subset of MLflow CLI commands, so a client
receives rendered text tables rather than structured data. And the two run-reading tools it exposes
(list_runs, describe_run) accept neither a filter nor an order_by. Ranking N experiments
therefore costs N+1 round trips of text to parse — precisely the operation a leaderboard exists to
perform.
The goal is the best forecasting system for grid operators, not novelty for its own sake. An autonomous session here is judged on whether a finding moves the leaderboard, not on whether it is publishable. A result reaching production has to beat the standing champion on the honest scorer (#958); publishable results are a welcome side effect, never the target.
A small literature review of existing autonomous-research agents grounds some of the design questions below. Lu et al. (2024)'s AI Scientist generates an idea, writes code, runs the experiment, writes the result up as a paper, and then runs an automated peer review — the review alone costs $0.25 to $0.50 in API calls per paper, and its automated reviewer reaches an F1 score of 0.57 against a human NeurIPS baseline of 0.49, correlating more closely with the average human reviewer's score than individual human reviewers correlate with each other. Gottweis et al. (2025)'s Co-Scientist ranks candidate hypotheses through an Elo-rated tournament between specialised agents (generation, reflection, ranking, evolution, proximity, and meta-review); across 203 research goals, hypothesis quality (measured by Elo rating) kept rising through more tournament rounds rather than plateauing quickly, evidence that spending more compute on ranking and revision continues to pay off. Du et al. (2023) show that a few rounds of debate between separate model instances beats both a single model and simple majority voting: three agents debating over two rounds raised arithmetic accuracy from 67.0% to 81.8%, and grade-school-math accuracy from 77.0% to 85.0%.
Those findings bear on three open questions raised in internal discussion. Adversarial review can be a large part of the answer to "is this finding real", not just a formality — the AI Scientist's automated reviewer already exceeds a single human reviewer's F1 score on the same task, and an autonomous session here has an even stronger ground truth available than a simulated paper review: the leaderboard's honest scorer. Cross-critique between agents (debate) measurably improves reasoning on tasks close to what a research session does day to day — arithmetic and word-problem accuracy resemble the reasoning a session does when checking its own feature-engineering logic or reading a metrics table — which is direct evidence for, not just an analogy to, the "how do we get AI agents to critique each other's work" question raised in discussion. And a tournament-style search over candidate hypotheses (Co-Scientist) is one concrete answer to the breadth-versus-depth question: breadth comes from generating many hypotheses up front, depth comes from repeated tournament rounds against the current top of the ranking, and the two are not a manual dial but an emergent property of running more rounds.
Two questions remain open, unanswered by anything reviewed so far. None of the three papers use tree search as their own search strategy — the AI Scientist runs each idea once, and Co-Scientist's tournament is closer to an evolutionary search than a tree search — so whether a best-first tree-search-style expansion (spend more of the budget extending the most promising branch, prune the rest early) would out-perform a flat tournament here is untested by any of them. And none offers a mechanism for deciding the most informative next experiment, rather than the next experiment that is merely plausible — Co-Scientist's tournament ranks hypotheses that already exist; it does not choose what to generate next. An idea raised in internal discussion, drawn from self-driving-lab practice in materials science rather than from a paper this project has reviewed directly, is that this choice is the crucial component of an autonomous research loop — worth checking against that literature before relying on it.
Energy forecasting has an advantage over the fields the papers above are drawn from: a genuine, uncheatable check on results. Every one of the three papers above relies on a simulated review or a tournament between the system's own agents to judge whether a result is good — a check the system being judged had a hand in constructing. A promoted forecasting model is instead checked against actual future power delivery, which cannot be gamed by a session that has read the validation set, provided the scorer-protection work (#958) actually holds. Data is also comparatively plentiful (multiple full years of half-hourly data per series, once the training-history extension lands), and each experiment — an XGBoost training run scored against a fixed fold — is cheap and fast compared with a wet-lab experiment or a large model pretraining run. That combination is why an autonomous research session is worth building here even where the wider literature finds genuine recursive self-improvement still blocked in most domains (Duan et al., 2026, surveying the obstacles across scientific discovery, embodied AI, and software engineering).
How a session records its own experience over time is still undecided. The options are a dedicated hypothesis store — a structured record of what was tried, what was found, and why a branch was abandoned, richer than an MLflow run — or extending MLflow's existing experiment and run metadata to carry the same information. Neither has been evaluated against the other yet.
This whole section depends on #958 landing first. An autonomous session is only trustworthy once it cannot edit or bypass the scorer it is judged against.
v0.6 — Switching Events
Epic: #151. Internal only for first month, then shared with NGED. (v0.6 vs v0.7: we don't yet know which of switching events and capacity estimation will actually land first — but naming one v0.6 and the other v0.7 beats the ambiguity of "v0.6 or v0.7"; we'll swap them later if reality disagrees.)
- Build the shared switching infrastructure: the stage-1 weather/calendar baseline, normalised residuals, the labelled event table, and the synthetic-injection harness — see Switching events & latent demand
- Ingest the NGED supporting files this needs (substation adjacency, switching logs)
- Make the forecaster switching-aware with residual, event-age, and pooled-neighbour features, and run the v1 label-exclusion experiments — the feature-based mainline
- Conditional — see the decision
point:
the discrete detector (changepoint detection and attribution), training-data cleaning from
detected events, and the
substation_switchingDelta table
v0.7 — Dynamic Generator Capacity
Epic: #141. Internal only for first month, then shared with NGED.
Dynamic effective capacity estimation for metered generators (capacity estimation)
The estimator is chosen by racing candidates head-to-head on the same data, and the winner ships in v1. What they estimate is the effective capacity of the metered wind and solar PV generators over time, which bumps up and down with maintenance, faults, and build-out. The contenders are a convex (CVXPY) censored quantile-envelope estimator, a differentiable-physics (PyTorch) variational estimator, and cheap baselines. The judging criteria — including uncertainty quality and robustness to missing inputs, scored against the same failure-scenario vocabulary the forecasting leaderboard uses — are on the capacity estimation page.
Capacity estimation is the first model family we must actively build for missingness. A differentiable-physics estimator degrades most gracefully of all, and that should count in the judging.
A deliberate secondary goal of the contest is building hands-on CVXPY experience, to inform v2 tooling choices and our advice to NGED.
The "clever" latent-demand and abnormal-running-arrangement inversion is explicitly not in scope here. That inversion is v2 research.
The remaining work items for metered-generator capacity:
- Two-pass approach: first pass estimates effective capacity; second pass normalises the time series by effective capacity before training the power forecast model
- Ingest CAMS (Copernicus Atmosphere Monitoring Service) solar radiation — satellite-derived irradiance, used to estimate solar PV capacity (data sources). Capacity estimation also needs ERA5, which v0.5 already ingests to serve the pre-training experiments
- Populate the
effective_capacityDelta table
CAMS is an offline source: it feeds historical capacity estimation, and the production serving path does not depend on it, so its near-real-time freshness is not the reason we chose it. The reasons are that its values accumulate over the metering interval rather than sampling an instant, that it draws on 3-hourly aerosol analyses, and that it offers steps down to 1 minute — which is what the dynamic thermal model would need.
The ingest is small. CAMS serves one point per request rather than a grid, but the v1 trial area needs at most 32 requests, and 6 of those requests cover its solar farms. CM SAF SARAH-3 stays on the list as a v2 comparison.
Dynamic effective capacity estimation for substations:
- For now, while we're forecasting substations top-down, just use the 99th percentile per year as the effective capacity. Later, in v2, the system should already capture everything we need to know about substation capacity, as a function of all the weather, demand, and topology drivers of the substation's behaviour.
"Prevailing conditions" building block (needs both the v0.6 switching and v0.7 capacity blocks):
- Produce example Python code for NGED to construct a "prevailing conditions" forecast from OCF's building blocks
v0.8 — Improve Live Service
Epic: #323
The bucket for operational improvements to the running live service — efficiency, robustness, and operability polish discovered during early live running, as distinct from the forecast-skill milestones above. Items so far:
- Replace the polling schedules with Dagster sensors (#324): cheap "is there new data?" detection runs on the control-plane box, and Fargate tasks launch only when there is real work to do. Design context: Production Deployment — Design.
- Codify the AWS infrastructure as infra-as-code (#326): the Terraform-vs-CDK question and the sequencing (start at access-phasing Stage 2) are in the live-service plan; the account-portability requirement is in Handover to NGED.
- Consider seven pieces of industry best practice we currently lack (#449): input-drift detection, shadow deployment of a challenger model, a schema-evolution policy for the delivery contract (which may need pulling forward to v0.6), statistical process control on forecast error, naming poka-yoke among the design principles, a retraining cadence and trigger, and monitoring how NGED uses the delivered forecasts — each discussed in Design Principles → Industry best practices we have not yet absorbed. A holding issue: the task is to consider them once the live service has run for a while, not a commitment to build them.
v0.9 — Nice-to-haves if we have time
Epic: #361
Genuinely optional experiments worth trying if the schedule allows, sitting between the operational polish of v0.8 and the v1.0 trial-service milestone. Nothing downstream depends on any of them — if we are short on time, none of it blocks v1.0. Each lands as its own registered leaderboard experiment or controlled ad-hoc ablation, so we keep the result either way.
- Neural net vs XGBoost as a leaderboard experiment
(#362): does a simple
neural net — an MLP with a per-series embedding and quantile-regression heads — beat
gradient-boosted trees? XGBoost suits the current per-series regime (one model per series, on the
order of 10⁴–10⁵ rows), and the recurring "trees are bad at maths" pain is already handled cheaply
by the physics and residual features on the XGBoost improvements page.
So the decisive, cheap test is the sibling of the global model per
time_series_typewin: a global MLP against a global XGBoost on the identical feature frame, run once that win's prerequisites (per-series target normalisation, static per-series features, and init-time-anchored features) exist, so the comparison isolates the model family. A negative result de-risks the neural approaches on the post-v2 research list before we spend research time on the fancier ones. The spike must also state and test how it handles missing inputs: XGBoost gets NaN routing for free and an MLP does not, so a zero-filled MLP would lose the comparison for a reason that has nothing to do with model family (zero is a real physical value — see Encoders → Handling missing inputs), and it should be scored under the failure-scenario suite like any other experiment. - Additional NWP source, e.g. ICON-EU (#363): explore whether adding ICON-EU from Dynamical.org improves forecast skill over ECMWF ENS alone — the v1 nice-to-have version of the broader v2.1 multi-source item. Sized by the v0.5 perfect-weather ceiling: a low ceiling means there is little forecast-error headroom to chase and this drops down the list — though not off it, because ICON-EU's ~6.5 km grid could still beat 31 km ERA5 on representativeness, which that ceiling does not bound. Because ICON-EU's history starts early 2026 (shorter than the canonical CV folds) it is assessed via a controlled ad-hoc ablation, not the leaderboard, until it has ~1–2 complete years of history. See Evaluating a data source whose history is shorter than the folds.
- Handle NWP model upgrades (#851): an upgraded weather model arrives on time and passes validation, so nothing in the live service notices it, yet the promoted model was trained on the old version. The plan records the NWP model cycle on every row, keeps a dated list of upgrades, treats an upgrade as a degradation that widens the uncertainty bands, and retrains early. It starts with an experiment measuring how fast a model recovers after the Met Office's January 2026 upgrade of UKV. See Live service → NWP model upgrades.
v1.0 — Stable Live Service for NGED's Trial Area
Epic: #133
Target: January 2027
- All features listed above (v0.1–v0.8), plus fixes discovered during live running
- 32 time series in the NGED trial area (scope)
- Five Delta Lake output tables delivered to NGED every 6 hours:
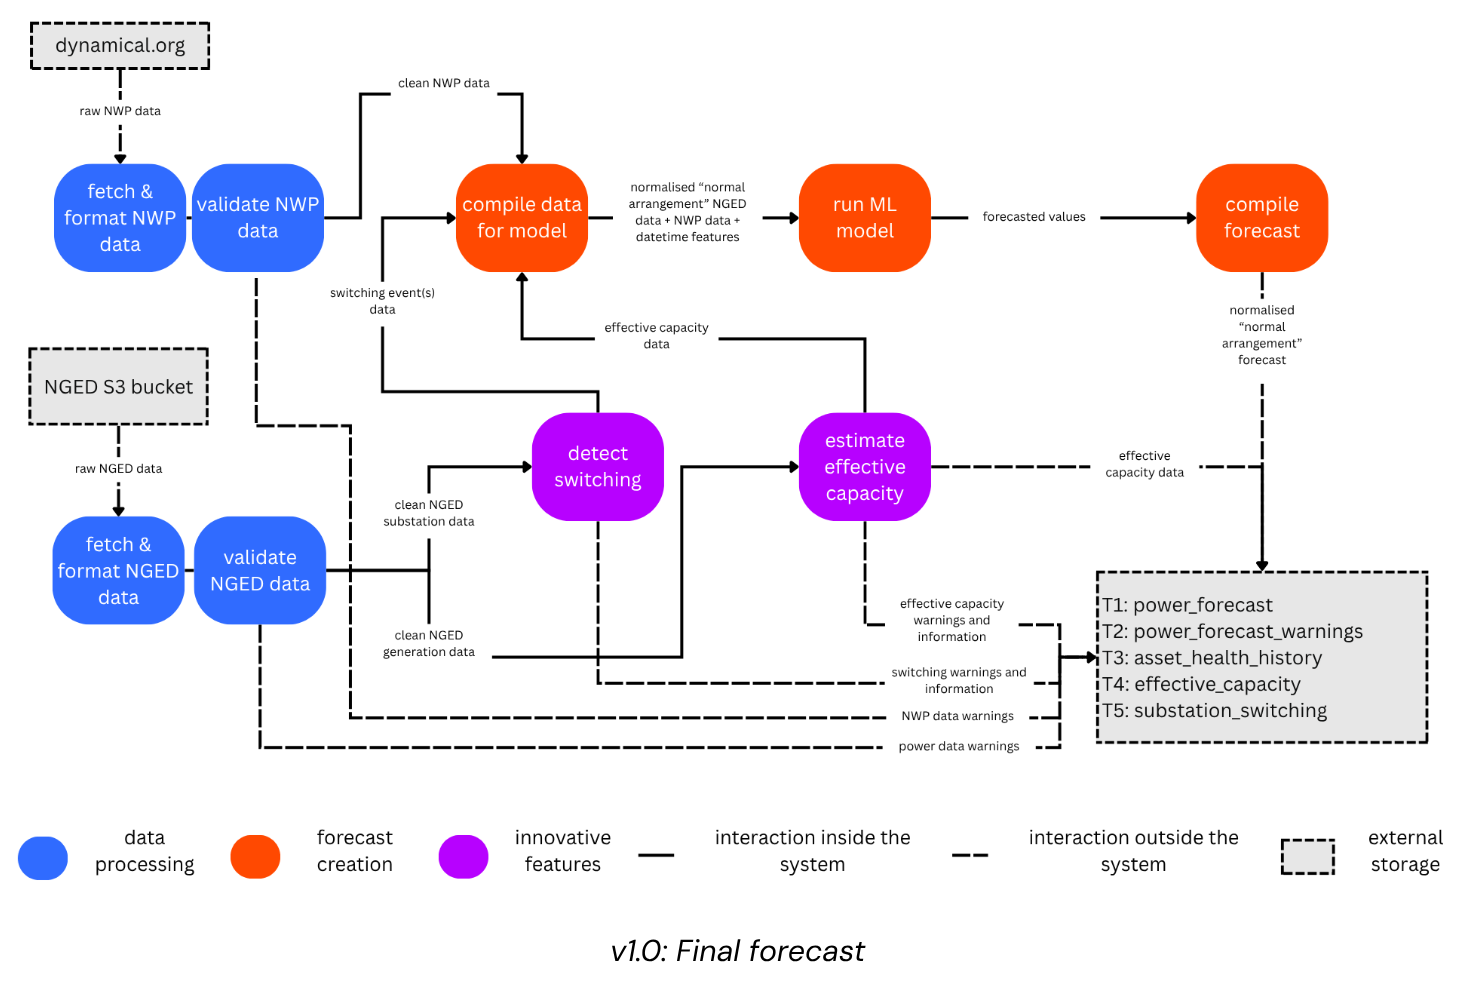
power_forecast— [−1, +1] ensemble power forecastspower_forecast_warnings— meter, generator, and feed-health warnings pertime_series_id(the nine warning types)asset_health_history— complete historical record of each time series's health stateeffective_capacity— half-hourly probabilistic effective-capacity estimates (mean + std after the v0.7 upgrade, #247; a static scalar per series in v0.1)substation_switching— estimated power diverted between substation pairs (mean + std)
v2.0 — Scale-Up
Epic: #156 (WP5: delivery of the v2 live service)
Required:
- Scale to approximately 2,500 time series: all of NGED's primary substations (1,161), BSPs (271), GSPs (52), and most customer meters (~1,000)
- Estimate the installed capacity of unmetered solar PV and wind on each primary substation (by disaggregating net primary substation power flows)
Stretch goals:
- Forecast unmetered solar and wind power at each primary substation
- Disaggregate additional DERs (price-sensitive assets like batteries) from substation power flow
- Build a REST API on top of the Delta Lake delivery mechanism (purely additive — see when a REST API would earn its keep)
v2.1 — XGBoost Improvements at Full Scale
v2.1 is about a month of XGBoost work, once the v2 live service runs for all 2,500 time series. v2.1 picks up whatever XGBoost improvements v0.5 left undone, and adds further NWP sources as features.
Model cards for promoted models
Deferred until after v2 ships. Every model promoted to production should get a model card recording detailed feature importance, calibration behaviour, and the population it was trained and validated against — the record an operator or an auditor needs to trust a specific promoted model. The Energy Systems Catapult DNO Forecasting Forum names model cards under the same "Explainability" characteristic as the feature attributions below, as what supports operator trust and incident investigation. A model card is a heavier, promotion-time record, distinct from the lightweight per-training-run feature attributions every model gets (see Log feature importances for every trained model). Model cards are a stretch beyond what v2 needs in order to ship live, so this workstream starts once the v2 service is running.
After v2.1 — Research (Advanced ML)
The research items run roughly in the order listed. The weather encoder trains through the differentiable-physics modules, so the encoder comes after the physics and disaggregation work.
- Differentiable physics for power forecasting (not just capacity estimation): use DP models to directly forecast power, handling MVA metering natively (see the graph-structured engine and MVA metering)
- Graph-structured disaggregation: Model substations, metered generators, and unmetered generator fleets as nodes in an electrical/spatial graph, with edges representing physical connections. The graph is a data structure — a structural prior on who can exchange load and which sites share weather: each substation is reconstructed as a sum of per-site differentiable-physics modules with inferred capacities, and cross-site gains come from hierarchical parameter sharing. (See Net-demand disaggregation — the canonical page for this arc, including the convex dictionary baseline it must beat — and the switching-events approaches.)
- Top-down forecast coherence checking: check whether independently-produced primary, BSP, and GSP forecasts sum consistently up the substation hierarchy — a lighter check than the comparison below, worth running first because it needs no new modelling, only the forecasts v2 already produces. The Energy Systems Catapult DNO Forecasting Forum names hierarchy coherence as its own forecast characteristic, for exactly this reason.
- Bottom-up vs top-down substation forecasts: compare a substation forecast built by summing the forecasts of the assets behind that substation (metered generators, disaggregated demand, and disaggregated unmetered generation) against a forecast of the substation's own net power taken directly, to see which is more accurate.
- Latent-demand recovery under switching: reconstruct the demand each substation would have metered under the normal running arrangement, using a time-varying neighbourhood mixture (optionally type-resolved into demand / PV / wind) over the network graph. This neighbourhood-mixture approach reconstructs the topology-normalised demand NGED requires, and goes beyond the v0.6 statistical detector — which only flags and masks switching periods. See Switching events & latent demand.
- Synthetic telemetry from fitted models, for the problems whose labels are missing: three of
this project's problems are scored against labels that are incomplete or absent — disaggregating
unmetered distributed energy resources (DERs), detecting switching events, and estimating the
effective capacity of metered generators. Fitting the per-site generation modules (differentiable
physics) and the shared demand-profile basis (the
BasisLoadNode), then running them forward on real weather and summing the sites, produces a simulated substation whose generation, demand, and capacity are all written down by construction. Editing the simulated sum writes the labels the other two problems need. Reassign a site from one substation's sum to a named neighbour over a known window to label a switching event; step a site's capacity down on a known date to label a capacity change. Both edits are exact in simulation, where the real-data harnesses can only approximate them by scaling a fraction of net power. The hazard is circularity: an estimator scored on data generated by its own model family measures whether the parameters are identifiable, not whether that model family matches reality. Two consequences follow. Parameters must be drawn afresh rather than frozen at their fitted values wherever the fitted value is the quantity under test — a capacity estimator scored against its own earlier answer measures only that the fit reproduces, and simulating with the same biased irradiance hides the weather-bias aliasing that page names as the dominant systematic error. And a passing score never stands alone, because the simulated telemetry carries none of the meter noise the switching detector's thresholds are normalised against. The simulator therefore supplements the real-data harnesses rather than replacing them: injection into real telemetry stays the primary evidence for switching detection, and the other disaggregation spokes stay the primary evidence for disaggregation. - JEPA (Joint Embedding Predictive Architecture, à la Yann LeCun): adapt to demand forecasting using JEPA's encoder and predictor as the "load" module in the graph-structured disaggregation engine
- Pre-trained neural network encoders: "weather encoder" and "time encoder" pre-trained on large datasets, then fine-tuned for substation forecasting
- Multi-sequence alignment with axial attention: find "similar" historical days and feed them as additional context to the forecasting model
- CRPS training objective: train the ensemble power forecast model to directly optimise CRPS for sharper probabilistic forecasts
- Modelling DER response to market signals (stretch goal, only if time remains well after v2): extend the differentiable-physics DER modules to react to a price signal directly — battery charge/discharge and other price-sensitive dispatch as a function of the market signal, rather than as unexplained residual behaviour
Handover to NGED (post-NIA operating model)
Epic: #309 — see Handover to NGED for the design.
The working assumption is that, after the NIA project, NGED runs the Flexpectation service on its own AWS account (see Requirements → Operating model & handover). This handover is not a single late milestone: it sets a standing design constraint from today (NGED staff who did not develop the code must be able to run the service day to day, working from the runbooks — the operator contract), one workstream that must start early (confirming NGED's cloud and security standards, because the Tailscale-based access design has to fit those standards), and a cluster of late-project work (runbook hardening, game days, and progressive transfer of control). The gate: OCF runs the full v2 service for a few months before NGED decides on the operating model after the NIA project.