How well does Primary demand research default 3's stack forecast D8 when the MVA meter's fold is modelled?
This experiment found no evidence that the fold in D8's meter explains D8's poor forecast score.
Fitting D8's demand model through the fold changes the quantile score by -0.23 points (95% bootstrap
interval -0.83 to +0.21), and the interval includes zero. The verdict is not supported. D8's score
stays about 3.5 points worse than BG2 whichever way the fold is treated. The larger problem is the
width of the forecast's uncertainty bands, which the stack calculates from the forecast errors of
six other Primaries. A band fitted on D8's own earlier months (an arm added after the main
comparison was scored, so it is exploratory) lowers the score by 2.22 points, to 1.32 points above
BG2. The evidence therefore favours trying that band change before any further work on the meter
model.
D8 (Marsh Lane) is a primary substation (Primary) whose meter reports apparent power in megavolt-amperes (MVA). Apparent power has no sign, so a flow back into the electricity network, the fold, appears as a positive reading. BG2 is the production-style forecast. On the quantile score, one point is 1% of D8's effective capacity (10.38 MW), and lower is better. The stack is the current research-default model for Primary demand (version 3): a convex demand model with a Kalman filter, plus a night offset and a correction called recipe R.
We rescored stored forecasts and did not refit anything. We took the stored ensemble forecasts
of experiment 152: one fit that
models the fold (the meter operator of experiment
110) and one that
treats the folded readings as ordinary signed demand. We added the night offset and recipe R of
experiment 252 to each, and scored them
against the card's forecast (experiment 252's arm A1), BG2, the manual heuristic, and climatology.
The stack was not refitted through the meter, because studies.dp_meter fits only the basic design,
not the stack's T-all design and 60% solar clip. The arms are A (the card's forecast), B
(fold-modelling fit plus night offset and recipe R), and C (signed-demand fit plus the same two
corrections).
Figure 1: the fold effect is a few tenths of a point, and its sign changes with the slice of rows.
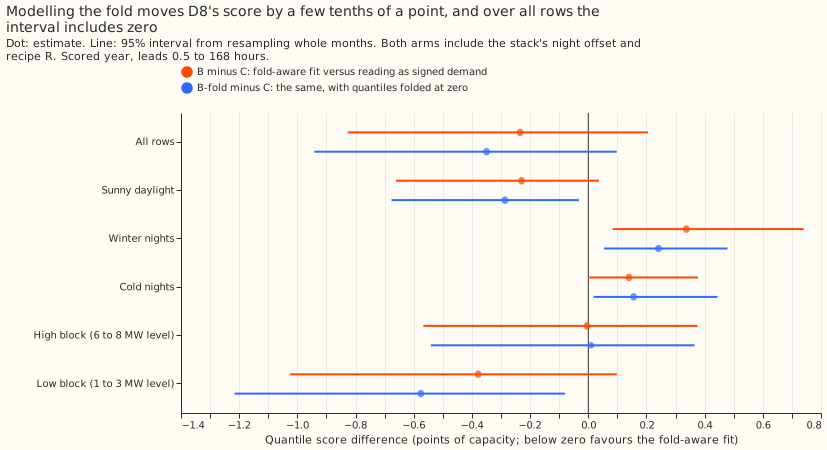
Figure 2: the borrowed band keeps every arm 2 to 4 points above BG2; D8's own band closes most of the gap.
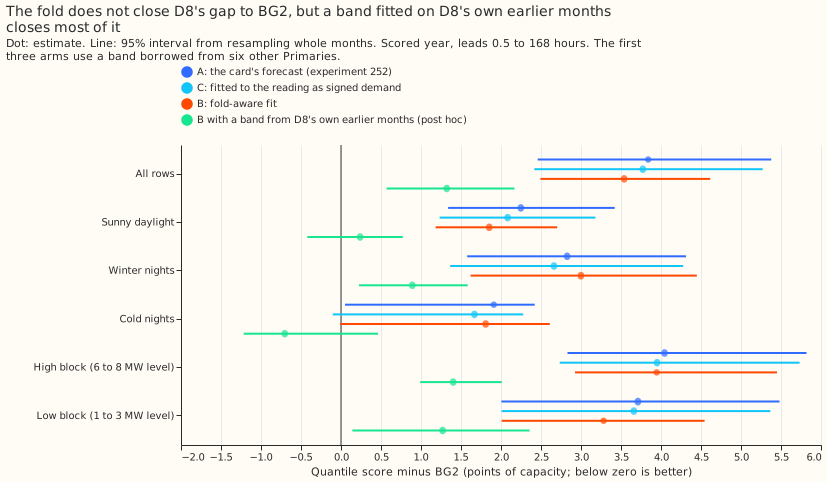
Figure 3: every stack arm scores about 3 points above BG2 in absolute terms.
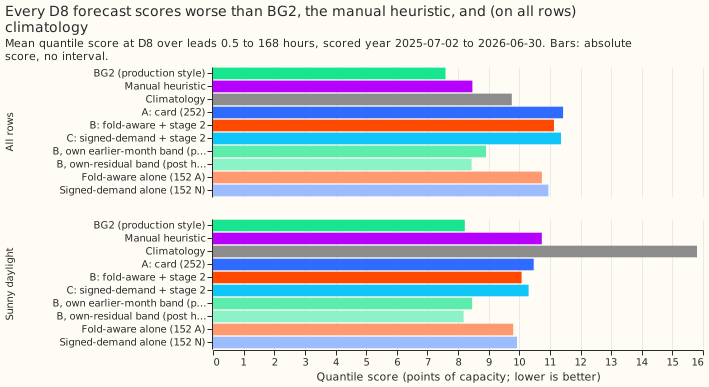
Figure 4: D8's readings jump between levels that the day-ahead forecast smooths over.
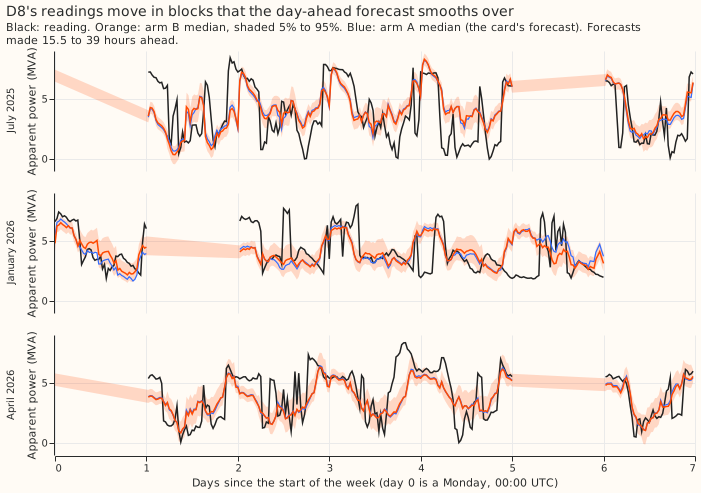
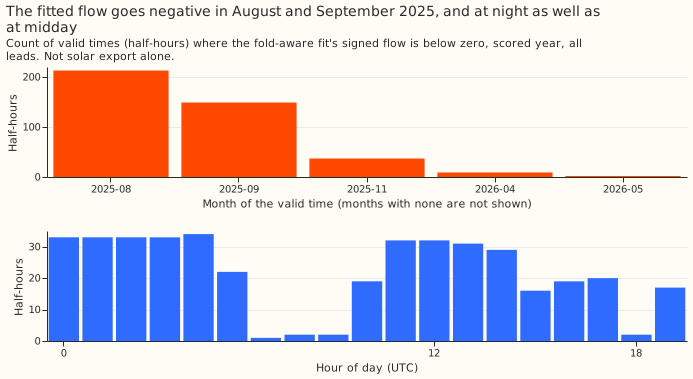
Figure 5: the fitted negative flow sits mostly in two months, and about half of it is at night.
Results
- Arms. A is experiment 252's arm A1 (stage-2 arm d) as stored. B is experiment 152's arm A (meter fit, symmetric quantiles) plus the night offset and recipe R. B-fold is experiment 152's arm F (quantiles folded at zero) with the same shift added to its quantiles; it keeps arm F's own band and has no refitted band, so B-fold minus B mixes the fold with a change of band and only B-fold minus C is quoted. C is experiment 152's arm N plus the same stage 2. The fits are monthly on 3 to 14 months of data from 2025-04-01. This excludes the change in what D8's series measures in April 2025. The width of the uncertainty band comes from the forecast errors of six other Primaries (D2, D3, D4, D19, D21, and D22) on a tuning period.
- Rows. 96,986 half-hourly rows, one per forecast run and valid time (97,012 before the join to BG2, climatology, and the manual heuristic drops 26), in the scored year 2025-07-02 to 2026-06-30, leads 0.5 to 168 hours. The stored ensemble forecasts stop at 168 hours, so the 168 to 240 hour blend of Primary demand research default 3 is not applied.
- The control gate passed. The script reproduces experiment 252's stored D8 scores: A1 11.433 and BG2 7.593. Experiment 152's F minus N at D8 is -0.190 here (-0.189 on its page).
- C1, B minus C (the verdict). All rows -0.234 (-0.827 to +0.205); sunny daylight -0.229 (-0.661 to +0.037). With folded quantiles (B-fold minus C) all rows -0.350 (-0.941 to +0.098) and sunny daylight -0.287 (-0.676 to -0.032). In winter nights B is worse than C by +0.337 (+0.084 to +0.740). The interval over all rows includes zero, so the fold does not meet the -0.10 threshold. Post hoc: in the first half of the scored year B minus C is -0.487 (-1.676 to +0.439) and in the second half +0.018 (-0.015 to +0.054).
- Absolute scores, all rows. B 11.132, B-fold 11.016, C 11.366, A 11.433, experiment 152's arms without stage 2: fold-aware 10.739, signed-demand 10.951. BG2 7.593, manual heuristic 8.469, climatology 9.757. On sunny daylight rows B 10.076, C 10.306, A 10.471, BG2 8.223, manual heuristic 10.735, climatology 15.806.
- C2, B minus A (descriptive). All rows -0.301 (-0.916 to +0.144); sunny daylight -0.395 (-0.893 to -0.087). B has no T-all design or solar clip, so the contrast mixes the fold with those pieces.
- C3, against BG2 (descriptive). B minus BG2 is +3.539 (+2.493 to +4.615) over all rows and +1.853 (+1.182 to +2.703) on sunny daylight rows. A minus BG2 is +3.840 (+2.458 to +5.378) and C minus BG2 is +3.773 (+2.416 to +5.271).
- A band from D8's own history closes most of the gap (post hoc, reference arm). Arm B with each month's uncertainty band fitted on D8's own earlier months (valid times before the month; July 2025 keeps the band from other Primaries) scores 8.914 over all rows and 8.462 on sunny daylight rows. B with own band minus B is -2.218 (-2.901 to -1.558); minus BG2 it is +1.321 (+0.570 to +2.168) over all rows, +0.239 (-0.421 to +0.773) on sunny daylight rows, and +0.804 (+0.581 to +1.043) in the second half of the year alone. The own-history arm's tail shares are 4.4%, 9.1%, 92.8%, and 96.6% at q01, q05, q95, and q99, against 21.4%, 31.0%, 72.0%, and 83.0% for B. The mean forecast is unchanged, so only the band moved. A band fitted on the scored rows themselves, which uses information a live forecast would not have and so is a best case, scores 8.443.
- High-level and low-level readings. Rows are split by whether D8's reading, as a 24-hour centred median, is at or above 4.5 MW (37,477 rows) or below it (59,509 rows). B minus C is -0.005 (-0.567 to +0.375) at the high level and -0.379 (-1.025 to +0.098) at the low level. The gap to BG2 is +3.95 at the high level and +3.28 at the low level, with overlapping intervals. Climatology (7.70) and the manual heuristic (7.85) score about as well as BG2 at the high level, so the stack arms with the borrowed band lose there (Figure 4).
- Reverse flow. The fitted signed flow is below zero on 1.8% of scored rows (2.9% of sunny daylight rows; 410 of 17,441 distinct valid times), down to -57% of effective capacity. 362 of those distinct valid times are in August and September 2025, and 188 are between 00:00 and 05:30 UTC, mostly before sunrise. About 198 are between 10:00 and 17:30 UTC, where solar export is possible. The readings are below 5% of effective capacity on 1.7% of rows. The night-time negative flow therefore marks drops in the readings. The daytime half could be export or drops, and the sign is not observable in an MVA meter.
- The night offset and recipe R scored worse than the fits they correct. They raise the score (higher is worse) by 0.39 (fold-aware: 10.739 to 11.132) and 0.42 (signed-demand: 10.951 to 11.366) over all rows, and by about 0.4 in the second half of the year alone (9.758 to 10.174). The offset alone is 11.067 and recipe R alone is 10.962 for the fold-aware arm. No interval was computed, and the step also replaces experiment 152's own band with the band from other Primaries.
- The stack arms leave far too many readings below q01. Share of readings at or below each quantile, all rows (nominal 1%, 5%, 95%, 99%): B 21.4%, 31.0%, 72.0%, 83.0%; C 21.6%, 31.1%, 72.2%, 82.9%; A 21.7%, 31.2%, 72.3%, 83.0%; BG2 0.2%, 4.0%, 94.4%, 99.8%. All stack arms put 21% of readings below q01.
- Not done. The curtailment-cost metric is not computed, because D8 is one series and the metric needs a node with its generators. The sign of D8's flow cannot be checked without signed megawatts.
Checks
- Median minus mean (points, all rows). B 0.00, C 0.00, A 0.00, B-fold -0.22 (the fold moves the median by design).
- Mean-forecast error beside the contrasts. Mean absolute error of the mean forecast: B 15.21, C 15.42, A 15.48, BG2's median 13.88. B is below C and A, the same direction as C1 and C2.
- Trigger 5 (a stage-2 arm scoring worse than the fit it corrects) fired: the stage-2 arms score worse than the fit they correct (B against experiment 152's arm A, and C against arm N). The first-year warm-up of the offset's expanding window explains part of the gap (B scores 12.093 against 11.722 for the unshifted fit in the first half of the scored year), but the gap remains in the second half (10.174 against 9.758). The Opus audit was waived by the manager; a Sonnet audit ran instead (next bullet). The fold verdict does not depend on it, because C1's interval includes zero with or without stage 2 (experiment 152's own N, A, F arms: -0.19 for F minus N).
- Sonnet audit of trigger 5. It re-scored the raw stored forecasts of experiment 152 and found no bug and no leakage (adding 500 to every later reading changed no earlier shift). It reproduced the three headline contrasts: B minus C -0.234 (-0.796 to +0.196), B minus unshifted fit +0.393 (+0.187 to +0.612), and own-history band minus B -2.218 (-2.899 to -1.559). Of the +0.393, +0.243 comes from the shifts (night offset +0.254, recipe R +0.073) and +0.150 from replacing experiment 152's band with the band of other Primaries. D8's level steps explain the harm: the realised night error regressed on the offset has slope -1.10. The audit did not re-run the donor Primaries or check how the own-history band behaves in the first quarter of 2026.
- Triggers 3, 4, 6, and 7 did not fire: the quantile score and the mean-forecast error agree in direction, there is one site so no leave-one-site-out check exists, no sister experiment has the same rows at D8, and no later design depends on this result.
Prediction against outcome
- (1) B minus C -0.30 to 0.00. Got -0.234. Held.
- (2) Reverse flow on 0 to 2% of half-hours. Got 1.8% of rows but 2.35% of distinct valid times (410 of 17,441). Partly held, and 188 of the 410 are at night, which the prediction did not expect.
- (3) B at least 1.5 points above BG2. Got +3.539. Held.
- (4) B within 0.5 points of A. Got -0.301. Held.
What to try next
- Fit the band on D8's own history. Arm B is 3.5 points above BG2 at D8, and the own-history band removes 2.2 of those points. The remaining 1.3 points sit in the high-level rows (+1.402, +0.989 to +2.010) and in winter nights. A term for D8's switching between two levels could address them; the D8 analysis of 2026-10-26 (a private brief) discusses it.
- Leave the night offset and recipe R off at D8 until D8 has more than 15 months of history.
- The stack's T-all design could be fitted through the meter at a Primary with strong reverse flow, such as D12; D8 does not need it.