Does masking load shifts found by a label-free detector lower curtailment cost?
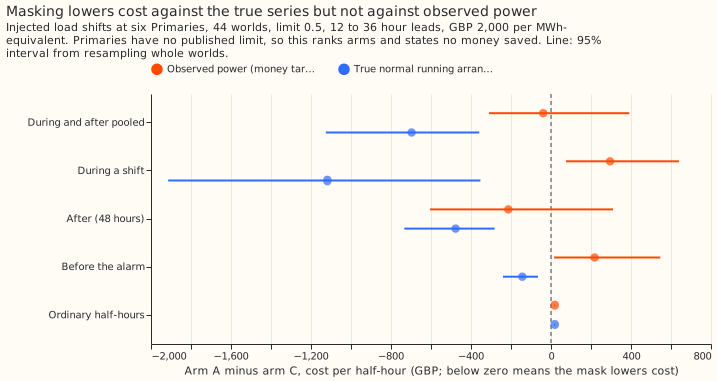
Masking the load shifts that a label-free detector finds lowers curtailment cost by about a third when the forecast is judged against the normal running arrangement, but not when it is judged against the power the electricity network carried. A load shift is demand moved from one substation to another for a period. The detector finds load shifts from the power readings alone, with no switching log. Masking means treating the flagged readings as missing when the forecast is corrected. The normal running arrangement is the network layout without any shift. Against observed power, the mask changes cost during and after shifts by -3.0% (95% interval -24% to +30%, from resampling whole worlds) and raises it by 1.3% on ordinary half-hours, the half-hours far from any shift. Adding the true moved megawatts to the true spans lowered during-shift cost, but adding them to the label-free mask did not, so this page cannot say what a live service would need. Verdict: not supported.
We asked whether the quantile-score gain that experiment 327 found for its label-free detect-and-mask pipeline also shows up as lower curtailment cost. Curtailment cost is the cost of cutting generation because a forecast let a substation's flow pass a limit, as defined by experiment 268. We scored experiment 327's forecasts on 44 worlds in which transfers of load between six Primary substations had been injected, and on the real record at one bulk supply point (D13) with its metered solar farms. A Primary has no published limit, so the injected-world costs rank forecasts and state no money saved.
Arms, rows, and data
- Arms. C is no mask. A masks the readings a label-free detector flags. B masks with a plain 24-hour residual detector. D masks the true (logged and labelled) spans, as a reference. E is A with a second detection pass. All five are experiment 327's, with its filter hyperparameters and quantile offsets unchanged. The filter was re-run to rebuild the quantiles, which 327 does not store.
- Injected worlds (Part 1). Experiment 327's
injfolder: 44 worlds at six Primaries, even calendar months, 12 to 36 hour leads, arms C, A, B, and D only. The limit is f times the Primary's largest real observed power before 2024-08-04 (before any scored row), the same for every arm and for both targets. - Real record (Part 2). The bulk supply point D13 has 7 child Primaries, all with stored forecasts. Its node forecast is the sum of the 7 child forecasts plus quantile offsets fitted on odd months. Its generators are the metered farms A, C, and E and two other generators. Experiment 243's quantile forecast for the farms and experiment 48's for the others are paired by valid time, which is a lab shortcut. D17 lacks one child forecast, so it is not scored.
- Headline price is GBP 2,000 per MWh, breach ratio 20, Curtailment Limit 0 hours.
- Not run. The long-and-deep stratum of experiment 327 has too few rows at cost-bearing limits to score. Arm E has no injected-world rows, so it is scored on the real record only.
Results
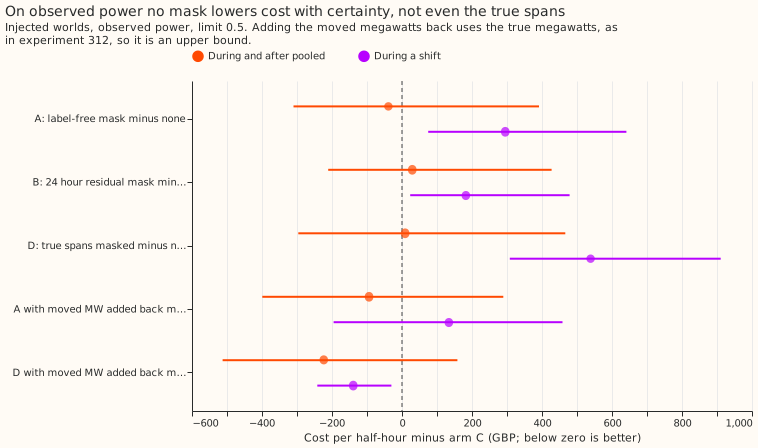
- Deciding contrast (A minus C, during and after pooled, observed power, limit 0.5). GBP 39 lower per half-hour (3.0% of C's GBP 1,291), 95% interval -310 to +392, from 10,149 half-hours. The smallest difference this design resolves is GBP 514. The interval includes zero, so the prediction fails.
- Ordinary half-hours. A minus C is +GBP 18.7 per half-hour (+1.3%, interval +16.6 to +21.2), above the 1% bound.
- By group, observed power. During: +295 (+36%, interval +75 to +641). After (48 hours): -213 (-13.8%, interval -604 to +311). Before the alarm: +218 (+17.4%, interval +16 to +547).
- Against the true series. During and after pooled: -697 (-32.8%, interval -1,126 to -359). During: -1,118 (-35.5%). After: -477 (-29.9%). B minus C is -334 (-15.7%), D minus C is -986 (-46.4%), and A minus B is -363 (interval -654 to -118).
- Moved megawatts added back (observed power, as experiment 312's perfect-megawatts arm). D with them: during -139 (-17.1%, interval -242 to -30). A with them: during +134 (interval -196 to +458), pooled -94 (interval -399 to +289). The true megawatts are used, so these are upper bounds.
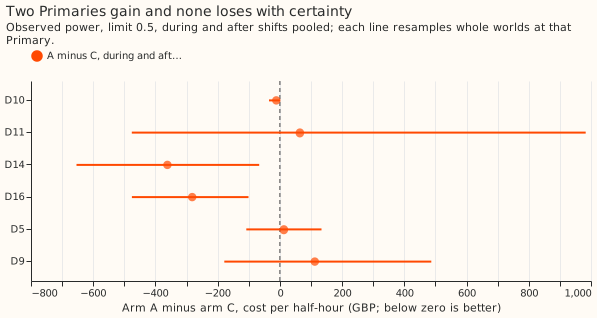
- Leave one Primary out (deciding contrast). Without D11: -117 (interval -223 to +2). Without D16: +46 (interval -301 to +599). Per Primary, D14 (-362, interval -654 to -66) and D16 (-282, interval -476 to -101) gain, and none of the other four has an interval below zero.
- Winter (November to March), observed power. During: +339 (interval +75 to +613, 176 half-hours). After: -134 (interval -389 to +113, 596 half-hours).
- Limit sensitivity (observed power, A minus C, during and after). At 0.75 the base cost is GBP 16 per half-hour and the difference is +17.5 (interval -4.9 to +64). At 0.9 no cost arises. Neither the 0.75 nor the 0.9 result is evidence.
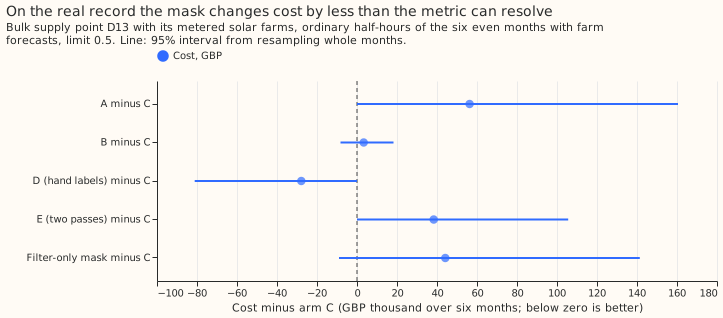
- Real record at D13, ordinary half-hours, limit 0.5 (12,544 distinct half-hours; 9,344 rows, each an origin and lead pair, were excluded because a span or label masks a child's target). Cost: C GBP 6.41 million, A 6.47 million, B 6.41 million, D 6.38 million, perfect forecast 0.45 million. A minus C is +GBP 56,300 (+0.9%, interval 0 to +160,494) against a smallest resolvable difference of GBP 138,727. B minus C is +3,349 (interval -8,258 to +18,306). Cost arises in April and June only. The after-shift groups hold no rows in the farm window.
- Tails. Quantile q01 and q99 coverage were not recomputed here. Experiment 327 reports them.
Checks
- Median minus mean forecast per site, and the mean-forecast error beside each contrast. Not applicable. No forecast was trained, and the stored mean-forecast errors are experiment 327's.
- Triggers fired. Three of the seven audit triggers fired. First, a control failed: the true-span arm D loses to arm C during a shift on observed power. Second, the result contradicts its own prediction. The add-back arm supports the moved-megawatts explanation for the true spans (D) and not for the label-free mask (A). Third, leaving one Primary out flips the sign of the point estimate (without D16 it is +46), but the interval includes zero with and without D16, so the verdict does not change.
- Audit. A fresh Sonnet agent re-derived the deciding contrast from the raw files with its own code, in place of an Opus audit, because this run was set to use no Opus. It found GBP 38.9 lower per half-hour (interval -309 to +388), ordinary +18.68 (+1.27%), and both leave-one-out values, with no error. A single world holds 22% to 41% of the pooled difference at D11 and D16, which is why the intervals resample whole worlds. The files hold both the earlier and the scored periods, and both are used, as in experiment 327.
- Weak node forecast. At D13 the NGED baseline (generators assumed at capacity, an assumption NGED has not confirmed) costs GBP 5.89 million, below every demand arm. The node forecast, which ignores the farms, is the weak link, so the real-record levels are not money saved. Arm contrasts share that weakness.
What to try next
- Test the mask together with an estimate of the moved megawatts. The true spans with the true megawatts added back lowered during-shift cost, and the label-free mask with them added back did not. Experiment 312 scored the megawatts with oracle values.
- Score the real record on a node that carries more shifts. D13 has no after-shift rows in the farm window, so a longer farm forecast history is needed before the money question can be asked of real data.