Does the share of a 30-day load transfer that a forecast learns as normal depend on the date the forecast is fitted?
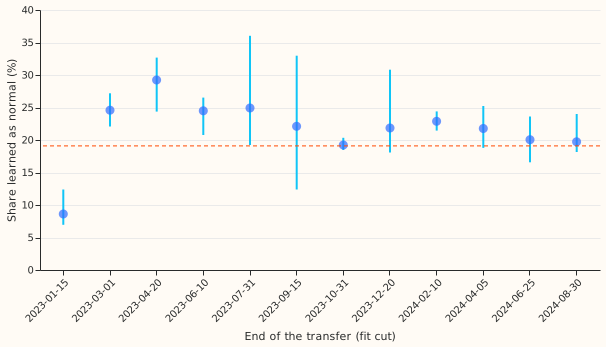
A forecast that uses no recent power readings learns on average 21.6% of a 30-day load transfer as normal, but the share ranges from 8.6% to 29.2% depending on the date the forecast is fitted. A load transfer is a spell in which an operator moves part of one substation's demand onto a neighbour. Experiment 274 added a transfer of 25% of a Primary substation's power (a substation that steps 33 kV down to 11 kV) for 30 days. It refitted a generalised additive model (GAM) every month, with no lagged power among its inputs, on the power series with the transfer added and on the series without it. The "share learned as normal" is the difference between the two forecasts, divided by the transfer. Experiment 274 found 2.49 points of effective capacity (1 point is 1% of the substation's capacity), or 19%, in the 48 hours after the transfer ended. It also noted that the bias changed when the fit was cut 12 hours later, and did not find the cause.
We repeated the 30-day, 25% case at 12 end dates between 15 January 2023 and 30 August 2024, at 10
Primary substations, fitting at the end of the transfer. The prediction was that the share learned
stays within 15% to 25% at every date. The prediction failed: the end-date means span 20.6
percentage points, so the verdict is not supported. The 19% of experiment 274 lies inside the
range, so that headline stands as a typical value. The weather inputs are the ERA5 reanalysis (the
European Centre for Medium-Range Weather Forecasts' estimate of past weather) and the CAMS
irradiance estimates (the Copernicus Atmosphere Monitoring Service), as in experiment 274.
Results
Figures are means over 10 substations. e00290_report.py prints every number in
printed_report.txt.
- Headline. Share learned in the 48 hours after the end: 21.6% on average over the 12 end dates (95% t interval 18.5% to 24.8%, from the spread of the 12 date means), range 8.6% to 29.2%. The bias ranges from 1.28 to 4.04 points, with a mean of 2.84 points over the 12 dates against 2.49 in experiment 274. The mean transfer ranges from 10.9 to 16.1 points, with a mean of 13.25 points.
- Lowest and highest. The lowest is the end date 2023-01-15 (8.6%, 1.28 points). The highest is 2023-04-20 (29.2%, 4.04 points). The other 10 dates lie between 19.2% and 24.9%.
- Position in the window. The position of the transfer in the 24-month training window is the same at every date, because every fit is cut at the end of the transfer, so the transfer is always the last 30 days of the window. This design cannot explain the spread.
- Season. A seasonal shape explains the spread only weakly. The lowest share is in mid-January (8.6%) and the highest in late April (29.2%), but the same calendar month differs by up to 7.4 points between years: April is 29.2% in 2023 and 21.8% in 2024, and June is 24.5% in 2023 and 20.0% in 2024. The two extreme dates have mean transfers of 14.8 and 13.7 points, near the middle of the 10.9 to 16.1 range, so the size of the transfer is unlikely to explain them. The cause is not located.
- Winter. The 2023-12-20 end date has a normal 48-hour share (21.8%), but the share over days 3 to 10 after the end is 2.0% and over days 10 to 17 is -8.6%. Christmas and the New Year fall in those windows. We did not test whether the holidays cause this.
- Substations. The share, with the fit cut at the end of the transfer, runs from 19.9% (D12) to 24.0% (D10), and the bias from 1.51 (D12) to 3.48 (D11) points.
- Later windows. Over days 3 to 10 the mean share is 19.3%, over days 10 to 17 it is 16.7%, and over days 3 to 33 it is 16.6%.
Checks
- Cut offset. Moving the cut from the end date to 72 hours later lowers the mean share over days 3 to 10 from 19.3% to 18.8%. Across all 120 jobs, a cut 12 hours later changes the bias over days 10 to 17 by at most 0.04 points.
- Experiment 274's jump.
e00290_diagnose.py(output indiagnose_report.txt) refits D3 with a transfer ending on 1 July 2023. A cut at the end gives 2.13 points and a cut 12 hours later gives 0.88, as in experiment 274. A transfer ending on 2 July falls from 3.52 to 2.81, and one ending on 20 June barely changes (2.25 to 2.24). The jump appears at two of three D3 end dates around the start of July and in none of the 120 jobs here, which avoid the first of a month. We did not find its mechanism, so we cannot say whether other substations show it at those dates. - Median minus mean. GAM_ONLY forecasts the mean, so there is no median-minus-mean gap to report.
- Audit. No Opus audit run; trigger 2 fired (agreed with the ML manager, to save quota).
- Audit triggers. One of the seven fired: the result contradicts the prediction written here (a share within 15% to 25% at every date). The explanation we tested, the position of the transfer in the training window, is excluded by the design, and the cause remains open. No Opus audit was run, because this session was limited to Sonnet models. The spread matters most to later experiments that quote the 19% of experiment 274 as a single figure.
Caveats and what to try next
- The cut is always at the end of the transfer, so the position of the shift in the 24-month window is fixed. Experiment 274 scored fits cut months after the end.
- One shape (a share of the substation's own power), one size (25%), one window (24 months), and one injection per date.
- The 95% t interval is from the 12 date means, not a bootstrap over substations as well.
- The spread is not explained. Testing the holiday explanation needs end dates in matched holiday and non-holiday weeks.
- Later experiments that report the share learned as normal could quote a range and use several end dates.