Is the neural head needed once the solar-farm power model sees the same inputs?
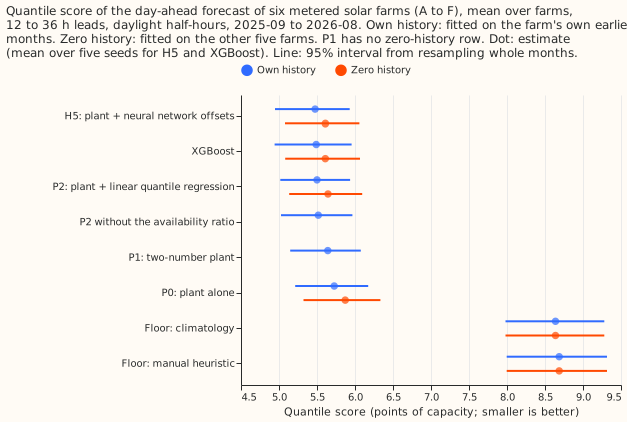
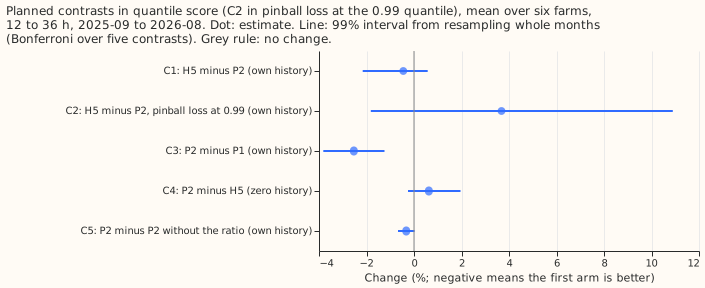
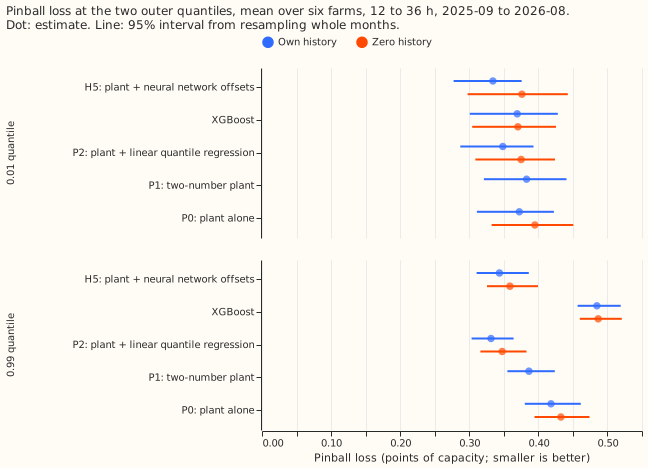
A linear quantile regression on the lagged power and the ensemble spread scores within 0.5% of the neural network of experiment 243, so the network was not needed. National Grid Electricity Distribution (NGED) meters six solar farms, labelled A to F. Experiment 243 found that H5, which adds a neural network that outputs 11 quantile offsets to the plant (a physical solar-farm power model that turns a weather forecast into a power forecast), scores 4.4% better than the plant alone, but H5 saw the lagged power and the ensemble spread and the plant did not. We gave a linear quantile regression (P2) the same inputs, with no network. With own history (fitted on each farm's own earlier months), P2's quantile score (twice the mean pinball loss over the 11 levels, in points of capacity; lower is better) is 5.500 against 5.475 for H5, so P2 is 0.45% worse (95% interval -1.7% to +0.4%; 99% interval -2.2% to +0.6%). P2 is 3.96% better than the plant alone, which is 90% of H5's gain. The prediction fails, so the stop rule set in advance applies: if P2 is within 1% of H5, the gain came from the inputs and not from the neural network. The prediction was that H5 beats P2 by at least 2% in quantile score and by at least 10% in pinball loss at the 0.99 quantile. The quantile-score gap is 0.45%, and at the 0.99 quantile P2 is better, with H5 3.7% worse (99% interval -1.8% to +10.9%). The hypothesis (that the inputs, not the neural network, produced the gain) is supported, because the prediction written to test it (that H5 beats P2) fails.
P2 beats the two-number plant, and the availability ratio adds little. P2 beats the two-number plant (P1) of experiment 224 by 2.5% (99% interval -3.8% to -1.2%). Removing the availability ratio (the farm's power one or two days earlier divided by the plant forecast for that half-hour) worsens the quantile score by 0.33% (99% interval -0.67% to +0.02%). With zero history, P2 is 0.63% worse than H5 (99% interval -0.25% to +1.96%).
Numbers
- Quantile score (points of capacity, mean over six farms, own history): H5 5.475, XGBoost 5.490, P2 5.500, P2 without the ratio 5.518, P1 5.642, plant 5.726, climatology 8.638, manual heuristic 8.687. Zero history: XGBoost 5.610, H5 5.610, P2 5.645, plant 5.871.
- Per farm, own history: P2 is within 0.1 of H5 at five farms (A, B, C, D, F) and 0.09 better at farm E (6.26 against 6.35).
- Median error (mean absolute error, MAE, of the median, points of capacity, own history): H5 9.85, XGBoost 9.89, P2 9.89, plant 9.95.
- Outer quantiles, own history (pinball loss at 0.01 and 0.99): H5 0.334 and 0.344, XGBoost 0.369 and 0.485, P2 0.349 and 0.331, plant 0.372 and 0.418. Coverage of the 0.01 and 0.99 quantiles: H5 0.033 and 0.985, P2 0.035 and 0.985, plant 0.034 and 0.984.
- Cloudy and clear half-hours (clear-sky index under 0.5 and 0.5 or more): H5 minus P2 is -2.7% when cloudy (99% interval -6.4% to +0.3%) and -0.15% when clear. P2 with the ratio is 0.48% worse than P2 without it when cloudy (99% interval -0.8% to +2.3%) and 0.42% better when clear (99% interval -0.8% to -0.1%).
Checks
- Fitting fault. P2 beats P1, which the plan named as the test of a fitting fault, so the fit is sound.
- Member alignment. The mean of the 51 members' responses differs from experiment 224's
unit_meanby 0.003 on average (mean absolute gap, 0.0026 to 0.0033 across the six farms), as expected from a non-linear plant, and the correlation is 0.9998. - Triggers. The prediction that H5 beats P2 by 2% fails, so the plan's audit trigger for a contradicted prediction fires and no other trigger does. The stored H5, XGBoost, and plant predictions are unchanged from experiment 243, and the rows are experiment 243's, so the contrasts pair on the same half-hours.
- Departures from the plan. The MAE of the mean forecast is not reported, because P2 outputs quantiles only.
What the next experiment should answer
The next experiment should test a small neural network against P2 with extra inputs, such as the neighbouring farms' power. P2 trails H5 by 0.45%, and the 99% interval (-2.2% to +0.6%) is wide enough that a gain of up to about 2% from a neural network cannot be ruled out, so the comparison is made against P2 and not against the plant alone.
Data-processing note
Experiment 268 found crossing quantiles in 26,344 of its 77,897 generator-forecast rows (34%), but all of them belong to three generators that are not solar farms, so none is on this page. Experiment 273 counted 0 crossing rows in every arm here, because the fit scripts sorted the 11 quantiles before writing them, so sorting does not change the scores on this page.