Does a better metered solar farm forecast lower the curtailment cost at its bulk supply point?
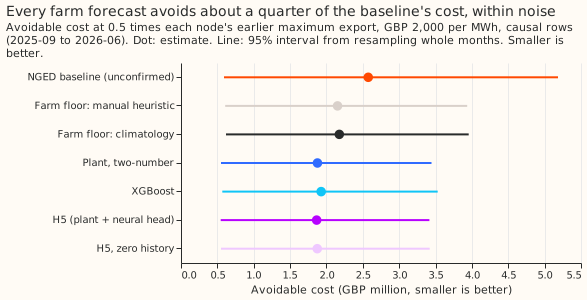
Forecasting each solar farm's output cut the cost of curtailing at Boston and raised it at Skegness, so across the two bulk supply points (132 kV to 33 kV substations) the saving of about a quarter is smaller than the uncertainty in the estimate. National Grid Electricity Distribution (NGED) meters six solar farms, labelled A to F, beneath these two substations. We asked what it would have cost to cap the generators whenever a forecast said a substation would export more than a limit, using the rule of experiment 84. We swapped in the farm forecasts of experiments 224 and 243, the same substation forecast in every arm, and compared each with a baseline that assumes every generator runs at full capacity. Verdict: inconclusive. At 0.5 times each substation's earlier maximum export, the avoidable cost (the cost above a perfect forecast, GBP 2,000 per MWh) is GBP 1.87 million for H5 (the plant plus a neural network, seed 0), 1.88 million for the plant alone, 1.93 million for XGBoost, and 2.57 million for the baseline. The three forecasts cut the baseline's avoidable cost by 25% to 28%, but every 95% interval includes zero (for example H5 minus the baseline: -0.71 million, interval -2.25 to +0.16 million). The prediction that all three contrasts are significant at the 5% level fails. The neural network's lower pinball loss at the 0.99 quantile cannot show in this rule, which reads only a farm's median. H5 beats XGBoost by 3.2% (99% interval 0.2% to 7.5%), under the 10% that would justify porting a neural network.
Numbers
- Design. The substation forecast is experiment 48's best guess in every arm, and the three generators that are not metered farms keep experiment 48's forecast. Only the six farms change. Farm forecasts are the stored 00 UTC runs at 12 to 36 hours lead, in fractions of capacity, scaled to MW and capped at capacity. Farms get 0 MW when the sun is under 5 degrees above the horizon. Setting those half-hours to zero discards 152.7 MWh of the 15,036.7 MWh metered (1.0%) in the causal rows.
- Causal rows are the headline. A substation forecast is made at 09 UTC for valid times 12 to 36 hours later, but a farm forecast for a valid time after 12 UTC the next day is the 00 UTC run of that day, which exists only after the substation forecast. The causal rows drop 2,711 of the 11,664 pairs of forecast origin and valid time. Dropping those pairs removes most of the midday and afternoon export peak. The valid-time pairing keeps all 11,664 pairs and gives each farm the forecast stored for its valid time, even when that forecast was made after the substation forecast. The valid-time pairing therefore favours the farm arms.
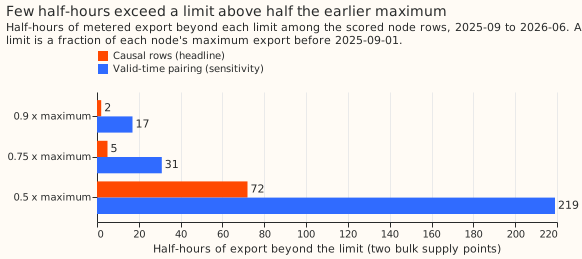
- Event half-hours (export beyond the limit, scored rows). Causal: 2 at 0.9 times the maximum, 5 at 0.75, 72 at 0.5. Valid-time pairing: 17, 31, 219. All flows in the window: 17, 36, 259. The stop rule fired (fewer than 20 at 0.75), so 0.5 is the only limit with a pre-registered contrast. Limits are 0.5, 0.75, and 0.9 times the maximum export before 2025-09-01. The published thermal limit was exceeded in 1 half-hour of the window and in none of the causal rows.
- Avoidable cost at 0.5, causal rows (GBP million, 95% interval): baseline 2.57 (0.59 to 5.18); manual-heuristic floor 2.15 (0.61 to 3.94); climatology floor 2.18 (0.62 to 3.96); plant 1.88 (0.55 to 3.44); XGBoost 1.93 (0.57 to 3.53); H5 1.87 (0.55 to 3.42); H5 zero history 1.87 (0.55 to 3.42). The perfect forecast costs GBP 0.29 million. H5 is GBP 46,300 per MW of forecast generator capacity per year (78.97 MW, 0.51 years of scored half-hours) and the baseline GBP 63,900. The five-seed mean of H5 and its other seeds sit within GBP 6,000 of seed 0 (1.86 to 1.87 million).
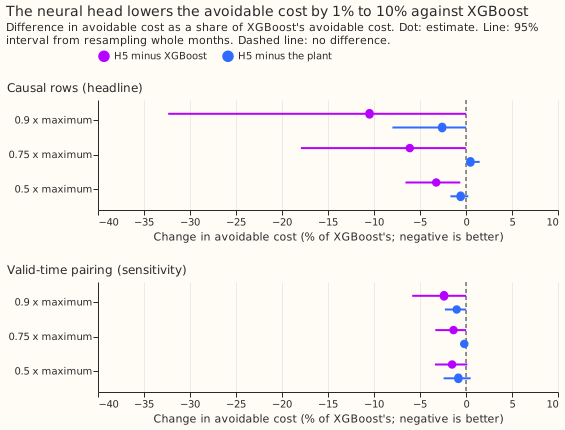
- Contrasts at 0.5, causal rows, with the Bonferroni 99% interval in GBP thousand: C1 plant minus baseline -698 (-2,935 to +258); C2 XGBoost minus baseline -647 (-2,847 to +302); C3 H5 minus baseline -710 (-2,971 to +241); C4 H5 minus XGBoost -62 (-145 to -4), or -3.2% of XGBoost's avoidable cost (-7.5% to -0.2%); C5 H5 minus plant -11 (-41 to +8). C4 is outside the 5% equivalence band (its lower end is -7.5%) and short of the 10% threshold. The 99% half-widths of C1 to C3 are about GBP 1.6 million, so the window cannot resolve a difference under about 60% of the baseline's avoidable cost.
- The other limits. Causal, 0.75: H5 minus XGBoost -6.1% (99% interval -23% to 0%). Causal, 0.9: -10.5% (99% interval -43% to 0%), on 2 half-hours. Valid-time pairing, 0.5: baseline 10.5, H5 7.25, XGBoost 7.36 (GBP million); H5 minus baseline -3.27 million (95% interval -10.4 to +0.8); H5 minus XGBoost -1.5% (99% interval -3.9% to +0.5%).
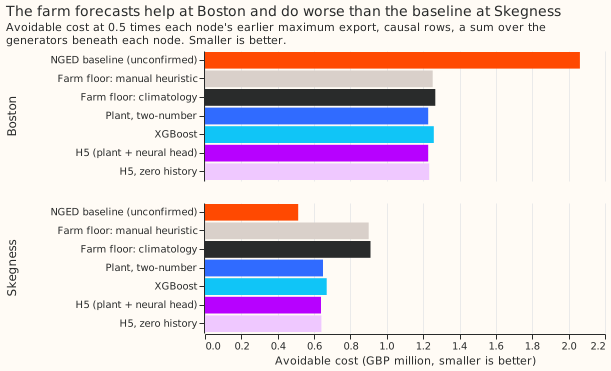
- By substation (causal, 0.5, a sum over the generators beneath each). Boston: baseline 2.06, H5 1.23, XGBoost 1.26 (GBP million). Skegness: baseline 0.51, H5 0.64, XGBoost 0.67. H5 beats XGBoost at both.
- Tails (daylight farm rows of the scored node rows, fractions of capacity). Coverage at the 0.01, 0.05, 0.95, and 0.99 levels: H5 0.034, 0.058, 0.935, 0.981; XGBoost 0.039, 0.075, 0.940, 0.993; plant 0.034, 0.053, 0.963, 0.990. Pinball loss at 0.99: H5 0.0039, plant 0.0042, XGBoost 0.0048.
- Weather and forecast time. The weather input is the European Centre for Medium-Range Weather Forecasts (ECMWF) ensemble run issued at 00:00 Coordinated Universal Time (UTC), at the nearest 0.25-degree grid cell. The farm power input is the metered output from one or two days earlier. Both exist at forecast time for the causal rows. One fit on the months before 2025-09 (experiment 243's screening schedule); nothing was refitted here.
- Departures from the plan. Intervals use 2,000 month-resampled draws (the
studies.bootstrapconstant). The plan had asked for 20,000. The 0.9 and 0.75 limits are reported for completeness only.
Checks
- Median minus mean forecast (points of capacity, mean over farms): H5 +0.38, plant +0.23, XGBoost -0.56.
- Mean-forecast error beside the contrasts. MAE of the median: H5 9.91, plant 10.07, XGBoost 9.96. MAE of the mean forecast: H5 9.98, plant 10.22, XGBoost 10.19. H5's small gain over XGBoost in cost (3.2%) agrees in direction with both.
- Triggers fired. Trigger 2 (the result contradicts the prediction): the first part fails on power, which the interval half-widths show; the second part holds in size (3.2%, under 5%) but not in interval, which excludes zero. Trigger 4 (leaving one site out flips a contrast): leaving Boston out reverses the sign of C1 to C3, because H5's avoidable cost at Skegness is 24% higher than the baseline's. Trigger 5 (a more informed arm does worse): the arm that knows every generator's actual output costs GBP 1.96 million against H5's 1.87 million, because a forecast below the actual output sets a lower cap and so cuts more (H5 curtails 491 MWh against 368 MWh, and breaches 29 MWh against 38 MWh), the same pattern as experiment 84.
What the next experiment should answer
Why the baseline beats every farm forecast at Skegness, and whether the same holds at the other bulk supply points when the delivery of about 2,500 series arrives. Two substations and 72 event half-hours cannot rank farm forecasts. A forecast that reads the farm's upper quantiles when it sets a cap is a candidate, since the neural network's gain is in the upper tail that this rule ignores.
Reproduce with uv run --no-sync python ml-experiments/00255-*/e00255_report.py and then
e00255_charts.py. The printed report is in
data/ml-experiments/00255-metered-farm-node-curtailment-value/report.md.
Data-processing note
Crossing quantiles affected this experiment's scores, though not the six solar farms' forecasts.
Three generators that are not solar farms store a forecast with 9 quantiles (0.05 to 0.95) and no
0.01 or 0.99 quantile. The scorer padded the two missing columns with nulls, and the step that caps
every quantile at the generator's capacity (pl.min_horizontal) turned each null into the capacity.
The 0.01 quantile therefore sat at capacity, above the 0.05 quantile, in 26,344 of 77,897
generator-forecast rows (34%), in every forecast arm, and the farms' own rows have none. Experiment
268 re-scored with the quantiles
sorted first: avoidable cost moves by -3.66% (climatology), -1.90% (manual heuristic), +1.08%
(XGBoost), +0.72% (H5), +0.62% (plant), and -0.59% (H5 with zero history), and H5 minus XGBoost
moves from GBP -62,407 to -69,766. Sorting only moves the capacity-valued 0.01 quantile to the top
of the row, so filling the missing 0.01 and 0.99 quantiles from the 0.05 and 0.95 quantiles is the
cleaner repair.