PV capacity: how well does a calibrated interval cover?
Take-home message: dividing the capacity found by the median recovery of other real farms removes most of the bias, and the interval built from the same recoveries is too narrow to call an 80% interval. The corrected estimate is within 10% of the injected capacity at all five decision Primaries when the calibration uses the same season-year. The interval covers 58.7% of held-out injections with that calibration and 78.7% with the all-years calibration. The interval covers 0% to 2% when a cloud-driven load is added to the Primary's demand.
What was done. The experiment fits nothing. It reads the recoveries that experiment 129 measured when it added the recorded output of a real solar farm (the five farms A, B, C, D, and F are metered generators and are never named) to a Primary substation's power at 20%, 50%, and 100% of the Primary's pinned capacity, for season-years 2019 to 2024. For each held-out farm at a Primary, the capacity found is divided by the median recovery of the other four farms at the same Primary, and the 80% interval runs from the capacity found divided by the 90th percentile of those recoveries to the capacity found divided by the 10th percentile. The calibration set is either the other farms in the same season-year (12 recoveries) or the other farms in every season-year (up to 72 recoveries). D5, D10, D11, D14, and D16 are the five decision Primaries (the substations whose capacity is judged). The recovery is the capacity found with the farm added, minus the capacity found without it, divided by the injected capacity, in the capacity unit of experiment 129 (the 99th percentile of alternating-current output over daylight half-hours, in MW). The stored fits stop at 2026-07-01, so the maintainer's labelled exception for capacity experiments (data to 2026-07-31) is not used, and no forecast is scored.
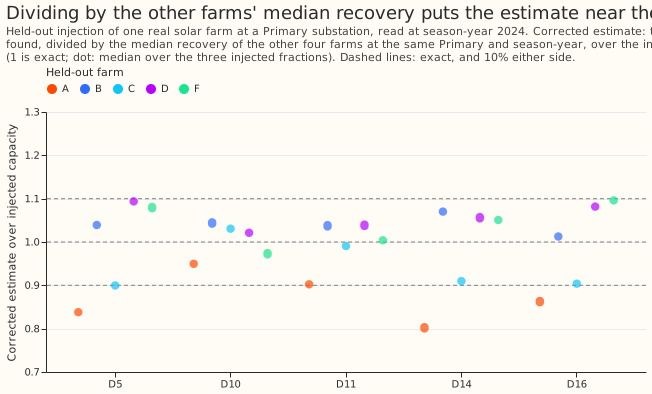
Figure 1. The corrected estimate is within 10% of the injected capacity for 63 of 75 held-out injections at the five decision Primaries (same-year calibration, season-year 2024).
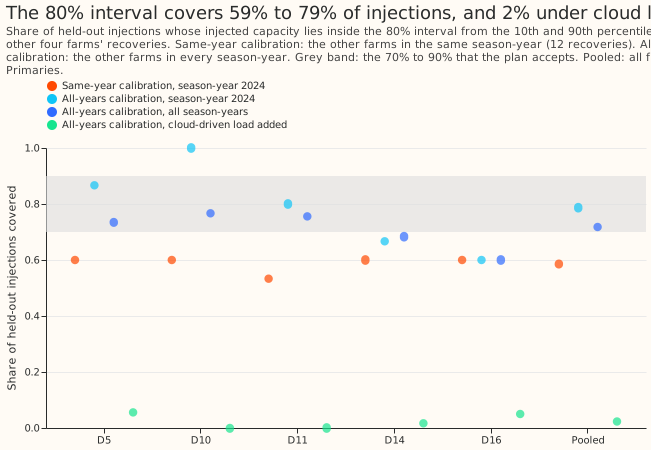
Figure 2. The 80% interval covers 59% to 79% of held-out injections, and 0% to 2% when a cloud-driven load is added.
Findings
- The accuracy condition is met with same-year calibration. The median absolute error of the corrected estimate is 0.032 to 0.094 of the injected capacity at the five Primaries (0.056 over all 75 held-out injections at season-year 2024), against 0.145 to 0.220 uncorrected (0.193 pooled). The corrected estimate is within 10% for 84% of those injections.
- The accuracy condition fails at 2 of 5 Primaries with all-years calibration. The median absolute error is 0.104 at D5 and 0.103 at D16, and 0.031 to 0.056 at the other three. The corrected estimate is within 10% for 73% of the injections.
- The coverage depends on the calibration set. At season-year 2024 the interval covers 58.7% of the 75 held-out injections with same-year calibration and 78.7% with all-years calibration. Over all season-years (six at three Primaries, four at D14 and D16) the coverage is 60.8% and 71.8% (390 injections). The target is 70% to 90%.
- The two conditions are met by different calibration sets, so neither set meets both. Same-year calibration meets the accuracy condition and misses the coverage range. All-years calibration is in the coverage range and misses the 4-of-5 accuracy requirement (3 of 5 Primaries pass). The plan did not say which calibration set decides, and the decision rule is not met by either.
- A cloud-driven load breaks the calibration. With experiment 129's cloud-driven load added to the held-out injection, the median corrected estimate is 26% to 30% too high (a median ratio of 1.26 to 1.30 at season-year 2024) and the interval covers 0% to 1.3% of injections (2.3% over all seasons with all-years calibration).
- The sample is smaller than it looks. The 3 injected fractions at each farm give nearly the same recovery, so the 75 injections at season-year 2024 are about 25 distinct farm and Primary pairs, and the Primaries share the same weather. With about 25 pairs, a coverage of 79% has a standard error of about 0.08.
Checks
- Row counts: every Primary holds 15 injections without load and 15 with load per season-year, except D14 and D16, which start at season-year 2021.
- Reproduction: the stored recovery equals the capacity found with the farm minus the capacity found without it, divided by the injected capacity, to within 1e-9, as the script checks.
- Median forecast minus mean forecast, and the mean-forecast error: not applicable, because the experiment scores no forecast.
- Audit triggers (the seven triggers in the
ml-experimentskill's "Audit before merge"): none of triggers 1 to 6 applies, because the experiment has no control, no sister experiment, and no nested arm. Trigger 7 may apply, because a later design may depend on the finding that the interval is not an 80% interval. The maintainer's decision on an audit is pending. - Review: one Sonnet review of the code and the page.
- No Opus audit was run. The ML manager decided that quota did not allow an Opus review of any of this series' experiments, so every audit trigger listed above stays unaudited and a Sonnet reviewer read the code and the page instead.
Limits
- The injections zero the farm's output when the sun is under 15 degrees above the horizon. Experiment 239 found that keeping that output raises the recovery by 0.033, so the recoveries here understate a farm that produces in winter. Dividing a real farm's estimate by them would overstate its capacity by about 4%.
- The calibration uses four farms, so the 10th and 90th percentiles sit close to the smallest and largest recovery, and a fifth farm falls outside that range at least 2 times in 5.
- The farms sit tens of kilometres from the Primaries, so a real unmetered farm near the Primary may differ in orientation and size from the five farms.
What the next experiment should answer
- Does a wider interval cover 80% of new farms? Widening the interval to the full range of the four recoveries, or taking the 90% interval from the all-years calibration, would test the coverage without changing the correction. The prediction that could fail is a coverage of 70% to 90% at 4 of 5 Primaries.
- How large is the shift from a cloud-driven load in real demand? The correction is 26% too high in that case. A measured demand response to cloud would show whether the shift is realistic.
Plan: design
- Held-out injection. One Primary, one farm, one fraction (20%, 50%, or 100% of the pinned capacity), and one season-year. The calibration set holds the same Primary's injections of the four other farms, without cloud-driven load. The held-out farm never enters its own calibration.
- Corrected estimate. The capacity found divided by the median recovery of the calibration set. Its ratio to the injected capacity is the held-out recovery divided by that median.
- Interval. The capacity found divided by the 90th percentile of the calibration recoveries (lower end), and by the 10th percentile (upper end).
- Two calibration sets. The four other farms at the same season-year as the held-out injection (12 recoveries), and the four other farms over all six season-years (72 recoveries).
- Reading. The decision reads season-year 2024, the last complete season-year, over 15 held-out injections per Primary (5 farms by 3 fractions). Coverage over all six season-years is reported beside it.
- Shift. The same intervals applied to injections with a cloud-driven load added (experiment
129's
cloud_loadrows) show whether the calibration survives demand that follows cloud. - Limit to state. The injections of experiment 129 set the farm's output to zero when the sun is lower than 15 degrees above the horizon, so the recoveries understate a farm that produces in winter.
Plan: checks
- Row counts: every Primary and season-year holds 15 injections without load, and 15 with load.
- Reproduction: the stored recoveries equal the capacity found with the farm minus the capacity found without it, divided by the injected capacity.