Do the real Primary series show jumps in solar capacity that match feed-in tariff installation dates?
The fit finds no more jumps in solar capacity in the real Primary series than it invents on test series where none exists, and the list of feed-in tariff solar installations stops before the months the fit uses, so no jump can be confirmed. We asked whether the power drawn at six Primary substations (labelled D5, D9, D10, D11, D14, and D16), which feed homes and businesses, shows sudden changes in the capacity of the solar panels connected to them. Experiment 207 built an estimate of solar capacity that is allowed to jump from one month to the next, and showed that the estimate finds a solar farm that we had added to a substation's power. Here we ran that estimate on the real April-to-August power of each Primary from July 2021 to June 2026, with nothing added, and listed every change of more than 0.5 MW. We found 7 such changes across 4 of the 6 Primaries. The only dated record of installations we hold, the feed-in tariff register (a list of small solar installations paid under a UK subsidy scheme), ends on 2021-03-24. The project excludes every row before 2021-07-20 from training, because of the COVID-19 lockdown. No change can therefore be matched to an installation date.
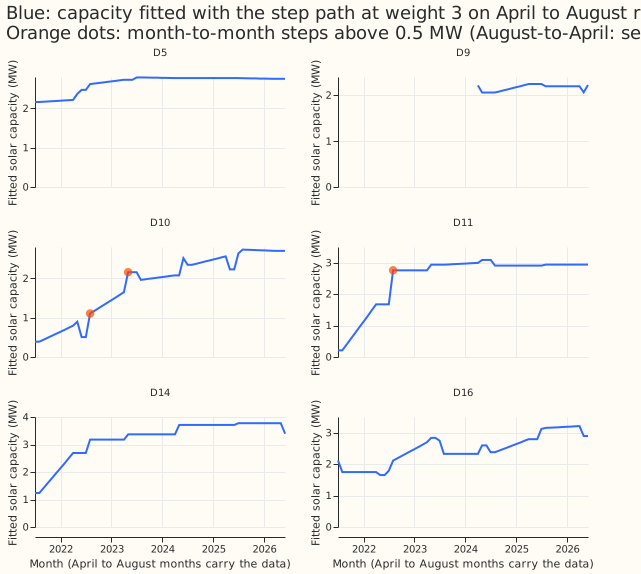
Figure 1: the fitted capacity rises at D10 to D16 and stays within 2.2 to 2.8 MW at D5, and the marked month-to-month changes above 0.5 MW are few.
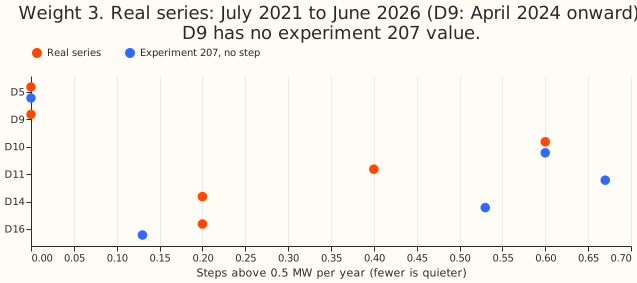
Figure 2: the real series show no more changes per year than experiment 207's series with no change, except at D16.
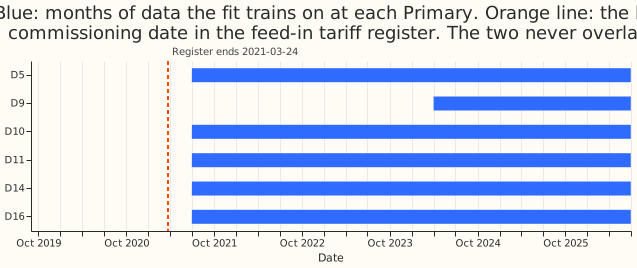
Figure 3: no month the fit trains on comes before the register's last commissioning date.
The prediction is partly supported: changes of 0.5 MW or more exist at 4 Primaries, none can be matched to an installation, and the placebo Primaries stay under 1 change per year. Whether a change at D10 or D16 lies within 60 days of a register cluster could not be tested, so that part of the prediction is neither confirmed nor refuted. D5 shows 0 changes and D14 shows 0.20 per year. The check that the scan code reproduces experiment 207's stored result at D10 passed (largest difference 1.7e-13, in the units of the fitted capacity).
Results
We used April to August half-hours from 2021-07 to 2026-06 at each Primary (D9 from 2024-04), after dropping the lockdown months and the periods of switching, which leaves 34,690 to 35,804 half-hours per Primary and 19,041 at D9. The fit uses every row, including rows after the date it describes, so it is a retrospective scan and not a forecast. The penalty on the total change in capacity has weight 3, as in experiment 207.
| Primary | Month-to-month changes | August-to-April changes | Per year | Experiment 207, per year, no change added |
|---|---|---|---|---|
| D5 | 0 | 0 | 0.00 | 0.00 |
| D9 (2.25 years) | 0 | 0 | 0.00 | none |
| D10 | 2 | 1 | 0.60 | 0.60 |
| D11 | 1 | 1 | 0.40 | 0.67 |
| D14 | 0 | 1 | 0.20 | 0.53 |
| D16 | 0 | 1 | 0.20 | 0.13 |
- All 7 changes are increases. D10: +0.60 MW (August 2022), +0.51 MW (May 2023), and +0.54 MW from August 2022 to April 2023. D11: +1.08 MW (August 2022) and +1.46 MW from August 2021 to April
- D14: +1.45 MW from August 2021 to April 2022. D16: +0.58 MW from August 2022 to April 2023. An August-to-April change is a net change across the winter. Its date is unknown within the winter, because the fit uses only April to August rows.
- The two changes of about +1.45 MW in the first winter, at D11 and D14, are probably fit artefacts. The two values are equal to within 0.02 MW, and the fit has no earlier summer to anchor either.
- No change falls in the register's period, so none can be matched. Between 2019-09 and 2021-03, no 60-day window at any Primary holds 0.5 MW or more of share-weighted registered capacity (the base rate is 0%). The register holds almost nothing from those months: 393 installations were commissioned across the whole register from April 2019 to March 2021, against 860,064 before April 2019, so even a fit that covered 2019 to 2021 could not find a cluster. Every change is therefore described as inferred, unconfirmed.
- Sensitivity (post hoc, not part of the verdict): at penalty weight 0.3 the fit finds 9, 3, 4, and 6 changes at D10, D11, D14, and D16 (none at D5, 2 at D9). At penalty weight 30 it finds one change each at D10, D11, and D14. The count falls as the penalty grows, as experiment 207 found.
- The fitted capacity at D10 rises from 0.4 MW in 2021 to 2.7 MW in 2026, and 1.7 MW of that 2.3 MW rise is in changes above 0.5 MW. D5 stays between 2.2 and 2.8 MW.
Checks
- Reproduction: refitted using only the data up to 2025-07-01, experiment 207's cut-off, the
scan's base path at D10 for weight 3 matches experiment 207's stored path in all 48 months
(largest difference 1.7e-13, in the units of the fitted capacity).
e00215_scan.pyprints it. - Forecast checks: this experiment scores no forecast, so the forecast checks do not apply.
- Audit triggers: none fired. The untested match is explained in the verdict paragraph and is not an unexplained contradiction.
- Plan correction: the plan expected that changes in the summer of 2020 could be matched. The lockdown window removes that summer from training.
What to try next
- Match the changes to a register that covers 2021 to 2026, or to the metered record of a known installation, before reading any change as a commissioning.
- Show the changes on the substation cards as inferred, and only once one is confirmed as real.
- Find a way to use the lockdown months without biasing the fit, so that the fit has a summer before 2021 to anchor the first winter.