Does the noise in NGED's metered wind series occur only at low wind speed, so that ERA5 wind speed alone can find the rows to drop?
The noisy near-zero rows in NGED's three metered wind series are not confined to low wind, so ERA5
wind speed alone cannot find them. A rule that excludes every half-hourly reading below a
wind-speed threshold removes 8.9% (W1), 9.9% (W2), and 15.2% (W3) of the readings. The rule still
leaves about 60% of the idle-band readings in the data. A probable cause, which we did not test, is
that ERA5 gives the wind in a 25 km cell, which can differ from the wind at the turbines by more
than the width of the cut-in region (the wind speed at which turbines start generating). The rows we
flag are stored in mask.parquet for the main wind-farm experiment to use.
We asked whether the idle noise (readings near zero, with repeated values, and in MVA a small non-zero floor) happens only when the wind is too light to turn the turbines. This is hypothesis H0, written down before any plot. We took half-hourly power from three of NGED's (National Grid Electricity Distribution's) metered wind farms, labelled W1 to W3 to keep them anonymous. W1 and W3 report apparent power in megavolt-amperes (MVA), which includes reactive power, and W2 reports real power in megawatts (MW). We took the wind speed at 100 m from ERA5, a weather reanalysis, at each farm's cell (Hersbach et al. (2020)). We then measured how often power sits in the idle band, which is the 5% to 95% range of power at ERA5 wind below 2 m/s, at each wind speed. The answer narrows the next step: a threshold on ERA5 wind speed is worth using only as one flag among several.
Verdict: not supported for all three farms. The prediction failed on both counts at every farm.
Results
- Data and alignment: 121,878 (W1), 121,940 (W2), and 121,535 (W3) half-hours from 2019-09 to 2026-09, with no nulls or duplicate times. The cleaning rules flag none of the three series. W1 has 185 gaps over 30 minutes (longest 5.0 days), W2 has 62 (longest about 10 days), and W3 has 227 (longest 38 hours). The longest identical-value runs are zeros of 108 to 155 half-hours. Power correlates best with ERA5 wind at lag 0 (0.858, 0.853, and 0.806), so no shift was applied.
- Weather used: ERA5 100 m wind speed, linearly interpolated between the two hourly instants either side of each half-hour's midpoint (the stored timestamp minus 15 minutes). ERA5 arrives about 5 days late, so ERA5 is a research-only input and the detector below could not run live on it. The two farms W2 and W3 share one ERA5 cell, so their weather is one series.
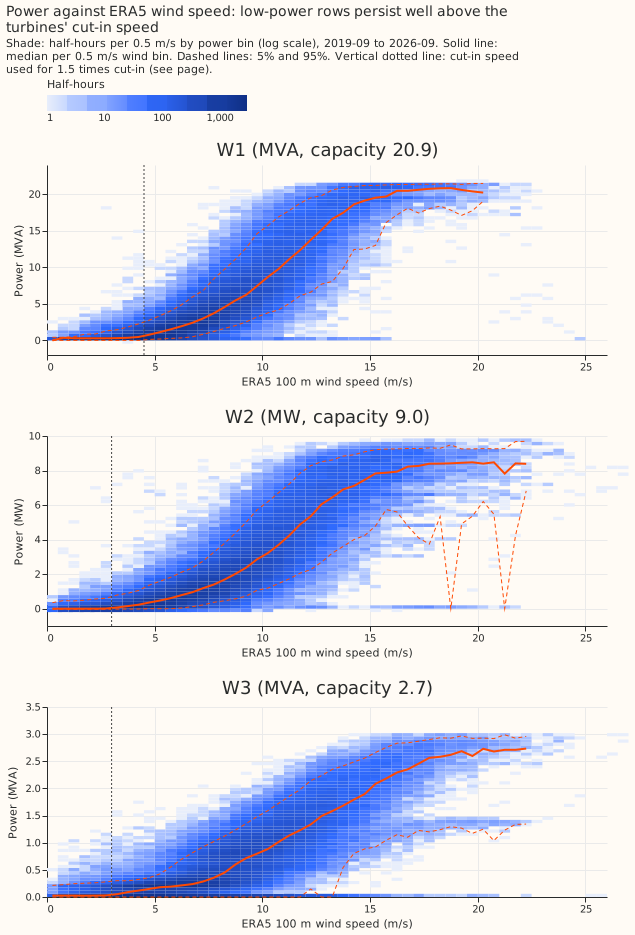
- Idle floor (ERA5 wind below 2 m/s): W1 median 0.299 MVA, 5% to 95% band 0 to 0.608, 41% exactly zero, 30% repeating the previous value. W2 median 0.000 MW, band -0.033 to 0.482, 40% negative (minimum -0.071), 19% exactly zero, 15% repeating. W3 median 0.025 MVA, band 0 to 0.243, 41% exactly zero, 27% repeating.
- A dip only at W1, and a tiny one: the lowest bin median between 2 and 5 m/s minus the idle median is -0.017 MVA at W1 (0.08% of capacity), 0.000 MW at W2, and +0.001 MVA at W3. No bin median falls below the idle floor's 5% value, so the expected dip is barely visible at half-hourly, farm-level resolution.
- H0 fails (pre-registered test): cut-in came out at 4.5 m/s for W1 and was set to the 3.0 m/s default for W2 and W3, whose empirical estimates (5.5 and 7.0 m/s) fell outside 2.5 to 4.5 m/s. So "above 1.5 times cut-in" means wind above 6.75 m/s (W1) and 4.5 m/s (W2 and W3). The 5% to 95% width per bin above that wind exceeds the reference residual width in 78% (W1), 100% (W2), and 100% (W3) of bins (median bin width 8.21 against 3.89 MVA, 4.38 against 0.99 MW, 1.68 against 0.34 MVA). The share of those rows in the idle band is 1.6% (W1), 13.0% (W2), and 29.9% (W3), against the 1% limit.
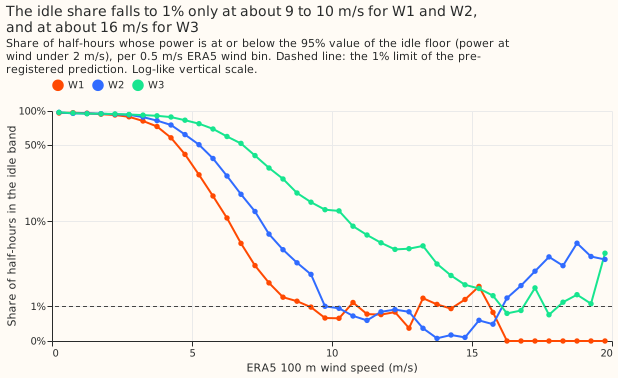
- The idle share falls to 1% only at high wind: the idle share crosses 1% at about 9 to 10 m/s for W1 and W2 and about 16 m/s for W3, which stays noisy around 1% beyond that (Figure 3). Above 10 m/s it is 0.8% (W1), 0.8% (W2), and 6.2% (W3). It is 11% to 27% at 5 to 6 m/s for W1, and 50% to 26% at the same speeds for W2.
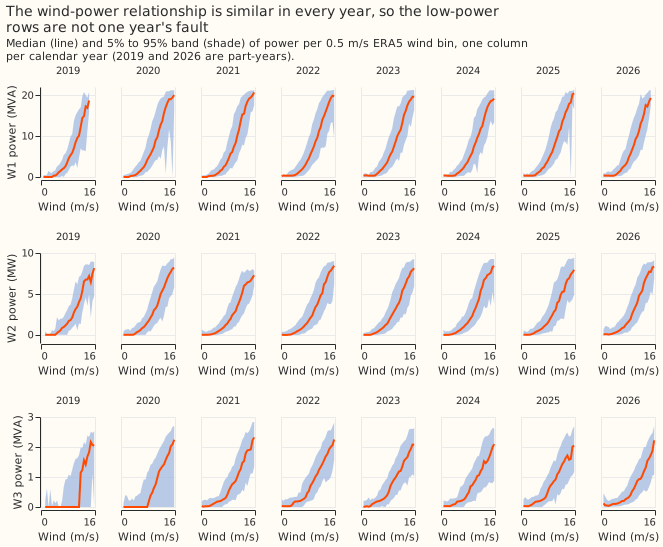
- Idle share by year: at W1 and W2 the idle share above 1.5 times cut-in is steady across years (W1 1.0% to 3.1%, W2 11% to 14%). At W3 it is 70% in 2019, 45% in 2020, and 23% to 32% from 2021 to 2026, and above 10 m/s it is 1.5% from 2021. The first 2 years of W3 therefore carry a regime change, not a wind effect (post hoc).
- W3 has a half-capacity level: at wind above 15 m/s, 13% of W3's half-hours sit between 40% and 60% of capacity and 1.6% below 10%, which suggests part of its capacity is often out of service. W1 (0.9%) and W2 (3.4%) show the same pattern far less (post hoc).
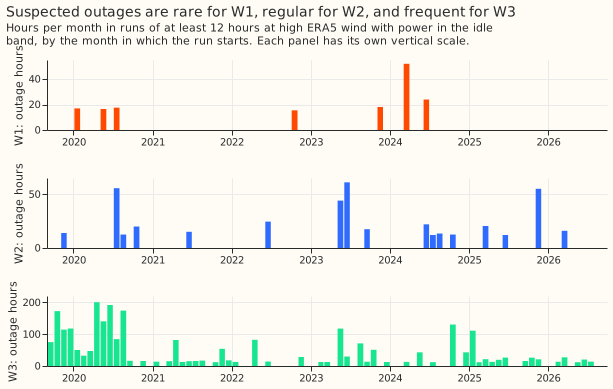
- Outage rows (at least 12 hours in the idle band at wind above 1.5 times cut-in): W1 has 9 runs, 160.5 hours in total, longest 24 hours, began in 2020 (3), 2022 (1), 2023 (1), and 2024 (4). W2 has 23 runs, 427.5 hours, longest 55 hours, began in every year from 2019 to 2026 (7 in 2023). W3 has 151 runs, 2,741.5 hours (4.5% of its half-hours), longest 49 hours, with 80 of them began in 2019 and 2020.
Detector (threshold on ERA5 wind speed, largest threshold with at most 5% false drops on the training years):
| Farm | Threshold, all years (m/s) | Dropped | False drops | Idle-band rows missed |
|---|---|---|---|---|
| W1 | 3.2 | 8.9% | 4.8% | 61.5% |
| W2 | 3.7 | 9.9% | 4.9% | 61.7% |
| W3 | 4.5 | 15.2% | 4.9% | 59.8% |
Out of sample, odd years to even years: W1 3.4 m/s, 10.0% dropped, 5.3% false, 57.8% missed; W2 3.5 m/s, 8.8%, 7.0%, 61.0%; W3 4.0 m/s, 11.5%, 4.5%, 69.2%. Even years to odd years: W1 3.1 m/s, 8.4%, 5.0%, 62.1%; W2 3.9 m/s, 11.2%, 3.6%, 61.2%; W3 5.0 m/s, 19.6%, 5.9%, 51.0%. The 5% false-drop limit applies to the training years, so a test-year rate can exceed it (W2 odd to even, 7.0%). A false drop is a dropped row with power above the idle band's 95% value plus 2% of capacity. A miss is an idle-band row, outside the suspected-outage runs, that the rule keeps.
- The mask: the stored table
mask.parquetholds 11,142 (W1), 12,903 (W2), and 24,009 (W3) rows, withdrop_reasonlow_wind_idle(10,821, 12,048, and 18,526) oroutage_suspected(321, 855, and 5,483). Those rows are 9.1%, 10.6%, and 19.8% of all rows. - Effect on the retained rows (median, 5%, 95%): W1 from 2.890, 0.000, 17.648 to 3.396, 0.251, 18.026 MVA. W2 from 1.538, 0.000, 7.875 to 1.856, 0.089, 8.013 MW. W3 from 0.374, 0.000, 2.095 to 0.617, 0.000, 2.211 MVA.
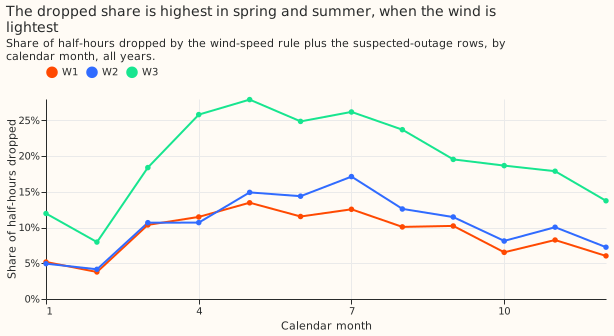
- Dropped share by month: highest from May to July (W1 about 13%, W2 about 14% to 17%, W3 about 25% to 28%) and lowest in February and December (W1 4% to 6%, W2 4% to 7%, W3 8% to 14%).
Checks
- Median forecast minus mean forecast, and quantile-score contrasts: not applicable, because the experiment fits no forecast and scores no quantile.
- Audit triggers: trigger 2 fired in the plain sense that the result contradicts its prediction. No explanation was tested. The idle share falls smoothly over 3 to 10 m/s (Figure 3), which fits ERA5's wind error but also fits curtailment or turbine availability, and the W3 excess by year fits a regime change but does not show one. Trigger 7 may apply, because the main wind-farm experiment depends on the mask; the manager decides whether an audit runs. Triggers 1, 3, 4, 5, and 6 do not apply (no control, no forecast contrasts, no nested arms).
- Sensitivity not run: the nearest-hour wind in place of the interpolated wind, and a cut-in speed other than the pre-registered estimate. The idle share at 10 m/s and above does not depend on the cut-in speed. It meets the 1% limit at W1 and W2 (0.8% each) and fails only at W3 (6.2%), so H0 fails over the 5 to 9 m/s range at all three farms, and above 10 m/s at W3.
What this narrows
- The idle floor exists, and above about 10 m/s it nearly disappears at W1 and W2, but ERA5 wind speed in a 25 km cell does not locate it. A rule on wind speed drops 9% to 15% of rows and finds only 30% to 50% of the idle-band rows out of sample.
- The main experiment can keep the mask as a default, with the caveat that it is a coarse, hard drop. An alternative to test is to leave the rows in and let the forecast's lower quantiles absorb the idle band.
- W3's first 2 years look like a different regime from the later years and hold most of W3's idle rows at high wind (idle share above 1.5 times cut-in 70% in 2019 and 45% in 2020, against 23% to 32% from 2021).
- Next: a detector that uses the farm's own recent power (available live after a 3.5-hour delay) rather than ERA5 alone, and a test of whether NGED's meters or turbine availability explain the 12-hour runs.
Caveats
- Cut-in speed, hub height, and turbine model are unknown, and the 1.5 times cut-in rule uses an estimate taken from ERA5, so the exact wind at which H0 is tested is soft. The idle share above 10 m/s does not use the cut-in estimate, so it is the check free of that softness.
- W2 and W3 share one ERA5 cell, so they are one independent weather series.
- The mask rule uses ERA5, which is not available at forecast time. It is for training and evaluation rows only.