E1: do a solar farm's meter outages show up in its Primary's power?
Metered-farm outages do not show up as extra solar generation at D10: the Primary's power does not change by the output of a metered solar farm when that farm's readings drop to zero. NGED removes the output of a metered solar farm from the power supplied by the Primary substation the farm sits under. If a farm's meter fails, the farm's output should then reappear in that Primary's power, which would look like a step up in the Primary's unmetered solar capacity. We found the outages of the six metered solar farms (labelled A to F) that last 3 days or more through the clear-sky hours of the day, and compared the Primary's power on those days with the 14 days either side. The Primary is the nearest one that shares the farm's bulk supply point, which is a guess, because NGED has not given the connections. Farm outputs are scaled by the farm's 99th-percentile output. At D10, the three zero-output outages that could be tested (farms A and C) changed the Primary's solar generation by -1% to -6% of the farm's output, the opposite sign to the prediction of +50% to +150%. The result narrows the search: meter failures at farms A and C do not explain capacity steps at D10, and the other decision Primaries could not be tested.
Verdict not supported. The pre-registered rule needed at least two thirds of the tested
outages to show the shift, and 0 of 3 did. The brief's stop rule therefore holds: experiments E3 and
E4 are not run. Experiment 207 (E2) ran at the same time, as instructed, and is a separate result.
Checks
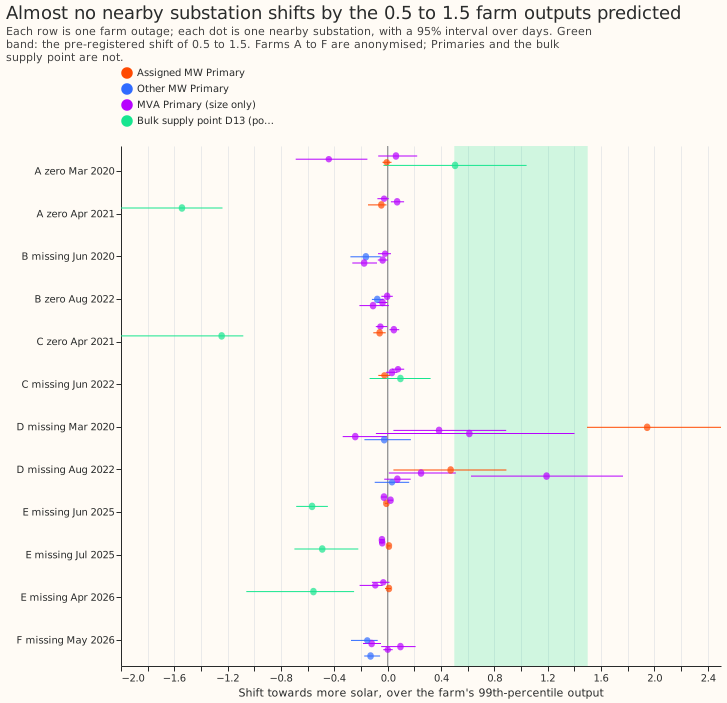
- Tested outages at the assigned Primary, as a share of the farm's 99th-percentile output (more solar is positive): farm A in March 2020 at D10 is -0.01 (95% interval -0.04 to 0.03), farm A in April 2021 at D10 is -0.05 (-0.15 to -0.01), and farm C in April 2021 at D10 is -0.06 (-0.11 to -0.02). In megawatts the Primary's power rose by 0.05, 0.29, and 0.49 MW, against farm outputs of 6.2, 6.2, and 8.1 MW. The two April 2021 outages overlap in time, so they are not independent.
- Untestable: farm F's zero outage (August 2025) has 1 sunny half-hour at D5, and farm B's zero outages are at D15 and D18, which are not decision Primaries. No farm is assigned to D11 or D16.
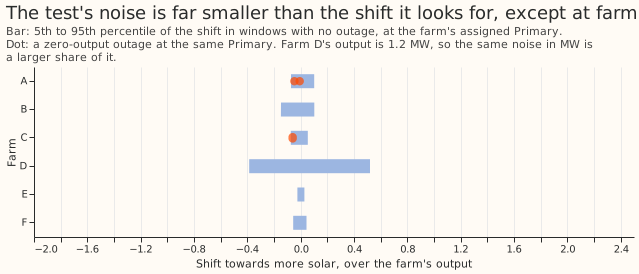
- Noise of the test: in 840 placebo windows with no outage (39 to 200 per farm), 7 shifted by 0.5 to 1.5 farm outputs in either direction (3 in the predicted direction), all at farm D. The 5th to 95th percentile of the placebo shift is within -0.15 to 0.10 of the farm's output for farms A, B, C, E, and F and -0.39 to 0.52 for farm D, whose output is only 1.2 MW.
- Other nearby substations: none of the 9 zero outages tested at the MVA Primaries (which carry no sign) and none of the 1 tested at another MW Primary shows a shift. Of the 13 outages with no readings, 1 of 20 MVA tests (farm D, August 2022, at D8: 1.19, interval 0.63 to 1.76) is in the band.
- Farm D's 101-day stretch without readings (March to July 2020) shifts its assigned Primary D14 by 1.95 farm outputs (1.49 to 2.59). The stretch is 7 times longer than the 14-day reference windows and spans the start of the 2020 lockdown, so the shift mixes demand and season changes with any generation effect.
- Bulk supply point D13, post hoc and with no placebo: two of farm E's three stretches without readings coincide with a rise of 9 to 10 MW in D13's power, -0.57 and -0.56 of farm E's output (more solar is positive); the third, from July to September 2025, is -0.49 (-0.69 to -0.26). Farms A and C's overlapping April 2021 outages coincide with a rise of about 10 MW, -1.54 and -1.25 of their outputs, and one event could cause both. Farm A's March 2020 outage shifts D13 by +0.51 (0.00 to 1.10), in the predicted direction.
- Audit triggers: the result contradicts its own prediction, so the
ml-experimentskill's second trigger fired. We tested two explanations, a wrong parent Primary (the MVA Primaries, above) and a connection above the Primaries (D13, above); neither shows the predicted shift at a Primary. The placebo control passed. No forecast is scored, and no later experiment is built on this result.
Method
- Row definition: a Primary's half-hourly supplied power in MW (the feature cache of experiment 106, with switching-event half-hours dropped), on sunny daylight half-hours only (clear-sky irradiance above 300 W/m² and CAMS irradiance at least 80% of clear-sky). No forecast is scored.
- Outages: 19 found (farm A 2, B 3, C 2, D 5, E 3, F 4), of which 6 are
zerooutages and 13missing. Farm E counts from its commissioning on 2024-10-06. - Farm-to-Primary map: NGED's hierarchy file gives bulk supply points for five of the six farms and no Primary, so the assigned Primary is the nearest MW Primary with the same bulk supply point (D10 for farms A, C, and E; D15 for B; D14 for D; D5 for F). The nearest Primaries of several farms report in MVA, which carries no sign, so the true parent may be one of those. The distances are 3.1 to 9.2 km.
- Amendment before any shift was seen: the minimum sunny half-hours were lowered from 100 and 300 to 20 and 60 (recorded on the plan before the first shift was computed).
- Differences from the plan, found in code review: the minimum is 2 sunny samples per half-hour of the day in each window (the plan said 3 before the amendment, which lowered it to 2); an outage bridges up to 4 calendar days that have fewer than 4 clear-sky half-hours; a placebo window must hold no bad day (at least 80% of clear-sky half-hours flagged or missing) and at least 3 eligible days, and starts in March to September; and the farm's 99th-percentile output is taken over unflagged half-hours with clear-sky irradiance above 20 W/m², which differs slightly from the capacity unit of experiment 129.
- Post hoc, labelled: MVA Primaries and the bulk supply point D13 were tested after the decision rule was applied, to explain the result. The bulk supply point uses the CAMS irradiance of D10 for its sunny mask.
What the next experiment should answer
A connection list from NGED would show where the farms connect. The farms' outages are not visible at the substations we could test. The list would show whether the farms feed the MVA Primaries, and the bulk supply point's response to farm E suggests the farm feeds a substation above the Primaries.