Differentiable physics: with the solar term explicit, does training the convex model on all history back to 2019 beat a 24-month window?
Training the convex demand model on every year back to 2019, instead of the last 24 months,
lowered its forecast error by only about 3% (0.08 points of substation capacity), and the difference
could be chance. The verdict is inconclusive. The demand model is a convex fit of substation
power from weather and calendar terms, and its quantile score (defined below) is the error measure.
The drift term, a term that lets the forecast level move slowly over the years, lowered the score by
0.38 points on 24 months and by 0.50 points on all history, about 5 to 6 times as much as the window
did. A post hoc audit found that a plain correction by the mean error of the last 28 training days
recovers 86% to 94% of that gain. The interval for the window's effect (98.75%, from resampling
months) runs from -0.19 to +0.01. We scored five Primary substations at 12 quarterly refits, on past
weather and not on weather forecasts. This experiment did not test whether explicit heating,
switching, or pooled terms would make longer history help.
We asked whether, with the solar term fixed, a longer training window helps the convex model of
studies.dp_gam. The solar term is a pinned capacity times a unit solar shape in every arm. We
refitted the model every quarter at 12 cut dates, called origins, from 1 July 2023 to 1 April 2026,
and scored each fit on the 3 months after its origin. The two windows are the last 24 months and
every year from the substation's first usable date (September 2019 to February 2021), each with and
without the drift term D1. Training and scoring use past weather only (ERA5 temperature and CAMS
irradiance), so every score is a ceiling for a forecast made on weather forecasts. "Score" means the
quantile score: twice the mean pinball loss over 11 quantiles, in percentage points of each
substation's effective capacity, where lower is better. Contrasts are treatment minus reference. C1
is all history minus 24 months with no drift term, C2 (the verdict) is the same with the drift term
in both, C3 is drift minus no drift on all history, and C4 is drift minus no drift on 24 months.
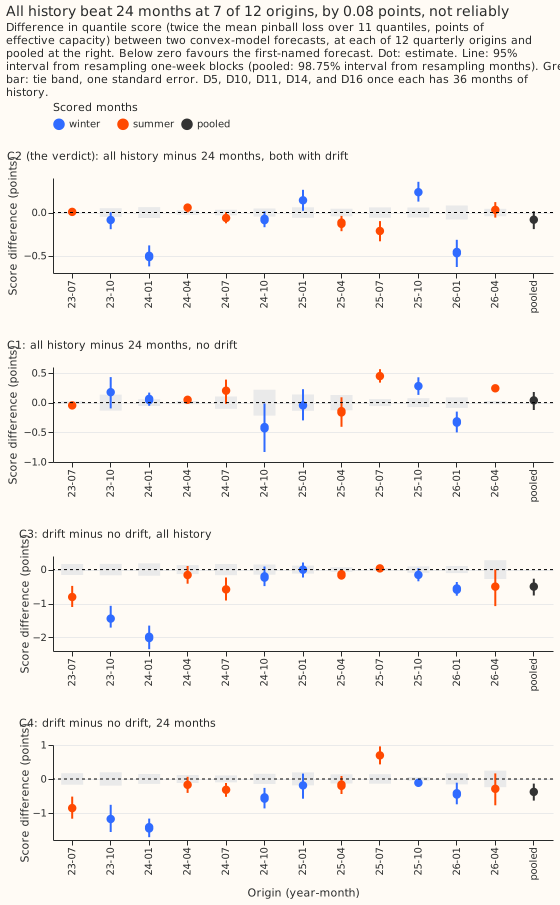
Figure 1 shows C2 at 7 of 12 origins below zero and at 4 above, and C1 with no stable sign. The largest C2 differences are at the January 2024 and January 2026 origins (-0.51 and -0.46). The four origins above zero are July 2023, April 2024, January 2025, and October 2025.
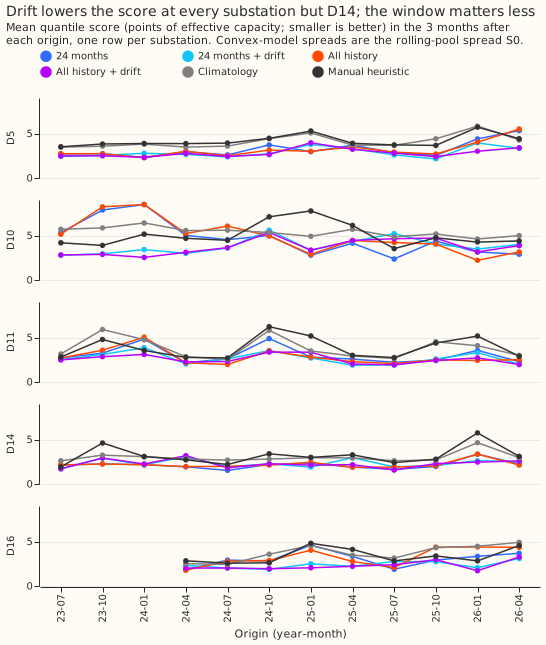
Figure 2 shows the drift term lowering the score at four of the five substations and the two windows trading places from origin to origin. Pooled scores run from 2.760 to 3.262 for the four arms. Climatology scores 4.010 and the manual heuristic 3.945.
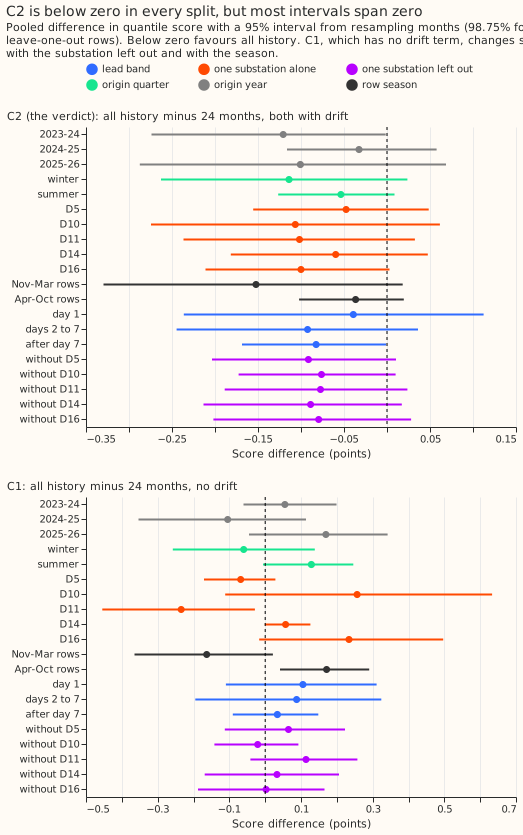
Figure 3 shows C2's estimate below zero in every split, with most intervals spanning zero. C1 changes sign by substation, by season, and when D10 is left out.
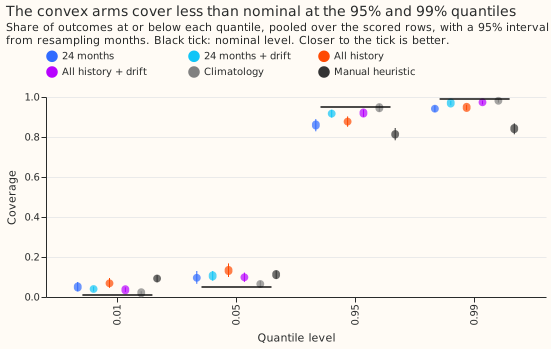
Figure 4 shows the drift arms covering about 92% at the 95% quantile and 97% at the 99% quantile, where the arms without drift cover 86% to 88% and 94% to 95%. Climatology comes closest to the nominal 95% (94.6%).
Results
- Arms: the convex model of
studies.dp_gamat experiment 104's tuned penalties (ridge 0.1, drift step 3,000) with experiment 45's pinned solar capacity: A24 (24 months, no drift), A24+D1, Aall (every year, no drift), and Aall+D1. The spread is experiment 107's baseline spread S0, fitted on each arm's own residuals over the 12 months before each origin. - Rows: experiment 107's
dp_mw_v1rows outside the hand-filtered switching events, at the substation-origin pairs with at least 36 whole months of usable history before the origin: D5, D10, D11, and D14 at all 12 origins and D16 from April 2024 (57 of 60 pairs), 241,983 half-hours. Quarterly refits, as experiment 107; weekly refits might change the contrasts. - Absolute scores (95% intervals from resampling months; mean error is actual minus mean forecast, in points):
| Arm | Score | Mean error |
|---|---|---|
| Aall+D1 | 2.760 [2.625, 2.906] | -0.064 |
| A24+D1 | 2.843 [2.694, 2.996] | -0.205 |
| A24 | 3.224 [2.998, 3.463] | +0.899 |
| Aall | 3.262 [3.090, 3.467] | -0.218 |
| Manual heuristic | 3.945 [3.680, 4.216] | +0.810 |
| Climatology | 4.010 [3.816, 4.213] | -1.201 |
- C2 (the verdict), all history minus 24 months, both with drift: -0.083 [-0.192, +0.014] (98.75% interval from resampling months; resampling whole origins gives [-0.240, +0.052]), 7 origins below zero, 4 above, 1 tied. The mean absolute error of the mean forecast contrast is -0.120 [-0.300, +0.047]. Winter-quarter origins give -0.114 [-0.263, +0.024] and summer-quarter origins -0.054 [-0.127, +0.009]. Leaving out each substation in turn gives -0.076 to -0.091, all below zero.
- C1, all history minus 24 months, no drift: +0.038 [-0.125, +0.178], 4 below, 6 above, 2 tied. Leaving out D10 gives -0.021. Rows from November to March give -0.163 [-0.365, +0.021] and rows from April to October +0.171 [+0.041, +0.290].
- C3, drift minus no drift on all history: -0.502 [-0.765, -0.270], 10 origins below zero, none above. Experiment 107 found -0.451 for the same contrast on its own rows, which include D16 at all 12 origins; the sign and size agree.
- C4, drift minus no drift on 24 months: -0.381 [-0.638, -0.136], 11 below, 1 above (resampling whole substation-origin pairs gives [-0.796, +0.002], so the claim is weaker than C3's). The drift term raised D14's score on both windows (+0.085 on all history, +0.202 on 24 months) and lowered the other four substations' by 0.23 to 1.22 (all history).
- Tail calibration (percentage of outcomes at or below the quantile; nominal 1, 5, 95, and 99; pinball loss in brackets):
| Arm | q01 | q05 | q95 | q99 |
|---|---|---|---|---|
| A24 | 5.0 (0.303) | 9.6 (0.845) | 86.0 (0.911) | 94.1 (0.309) |
| A24+D1 | 4.0 (0.217) | 10.6 (0.724) | 91.7 (0.777) | 97.0 (0.238) |
| Aall | 6.8 (0.352) | 13.2 (0.933) | 87.7 (0.880) | 94.8 (0.290) |
| Aall+D1 | 3.6 (0.214) | 9.8 (0.711) | 92.0 (0.737) | 97.4 (0.221) |
| Climatology | 2.1 (0.228) | 6.5 (0.873) | 94.6 (0.994) | 98.1 (0.270) |
| Manual heuristic | 9.2 (0.426) | 11.2 (0.906) | 81.5 (1.225) | 84.2 (0.749) |
- Curtailment cost: not computed. These are demand substations, and the node metric scores generators.
Pre-registered predictions and what happened
- C2 pooled between -0.30 and -0.05: held (-0.083).
- C2 below zero at 8 or more of 12 origins: failed (7).
- C2 larger in winter-quarter origins than summer: held (-0.114 against -0.054).
- C1 sign varies by origin: held (4 below, 6 above).
- C3 between -0.2 and -0.5: failed by 0.002 (-0.502). C4 smaller than C3: held (-0.381).
- C2 moves under 0.15 when one substation is left out: held (at most 0.008).
- Verdict: the interval spans zero, so
inconclusiveby the pre-registered rule.
Checks
- Median forecast minus mean forecast, per site: exactly 0.000 for every arm, because the centred spread has a zero median, so this check cannot expose a shifted forecast. The mean error in the absolute-score table does: the pooled values are A24 +0.899 and Aall+D1 -0.064, but they hide large biases that cancel. The audit's mean absolute bias per substation-origin pair is 3.66 for A24, 3.43 for Aall, 2.67 for A24+D1, and 2.46 for Aall+D1 points, and Aall+D1 reaches +8.3 at D10 for the 2025-10 origin.
- Mean absolute error of the mean forecast beside each score contrast: C1 +0.019 [-0.227, +0.240], C2 -0.120 [-0.300, +0.047], C3 -0.720 [-1.083, -0.386], C4 -0.581 [-0.966, -0.210]. Each of the four contrasts has the same sign as its score contrast.
- Blocking checks, all passed (the reproduction is in
report.txt; the other two are enforced in the scripts, which raise on a violation): Aall and Aall+D1 reproduce experiment 107's G-all and G-all+D1 means exactly over 350,428 rows each (maximum absolute difference 0.0), every fit's non-negativity violation is below 2e-15, every spread-pool row has a valid time at or before its origin, and the pairs scored per origin are 4 sites for the first 3 origins and 5 after. - Audit triggers. Triggers 2, 4, and 5 fired. Triggers 1, 3, 6, and 7 did not: the reproduction
controls match exactly (1), every mean-absolute-error contrast has the sign of its score contrast
(3), C3's interval is 1.1 times as wide as experiment 107's matching contrast (6), and no other
experiment cites this one (7). No audit has run: the
ml-experimentskill requires an Opus audit for a fired trigger, and the experiment's brief allows Sonnet only, so merging needs the maintainer's decision to waive the audit or to lift the limit. The verdict isinconclusive, and an audit could only turn it into a finding if it found a method fault.- Trigger 2 (contradicts its prediction): C2 was below zero at 7 origins, not 8 or more, and C3 missed its predicted range by 0.002. The origins above zero are July 2023, April 2024, January 2025, and October 2025. The explanation tested post hoc is the history rule's weakness below: the early origins hold little extra history.
- Trigger 4 (leaving one site out flips a sign): C1 flips to -0.021 without D10. C1 is not the verdict contrast, and C1 already had no stable sign.
- Trigger 5 (a nested arm wins): the 24-month arm scores 0.038 better than all history without drift, although the all-history window contains the 24 months. The difference is inside its interval. The seasonal split of C1 (post hoc) is the explanation tested.
Audit (Opus, post hoc, approved by the maintainer)
- Verdict stands. The audit refitted all 4 arms at 5 substations and 16 cuts from scratch. The means match to 4e-11 points, and C1 to C4 reproduce. Nothing leaks: the last drift knot uses training rows at or before the cut, and the forecast holds it flat.
- The drift term is a recent-level correction. A no-drift fit plus the mean residual of its last 28 training days, per hour band, recovers 94% of C3 and 86% of C4. Drift minus that fix is -0.031 [-0.145, +0.089] on all history and -0.055 [-0.239, +0.103] on 24 months, so the drift form is not shown to beat the simpler fix. A drift fit trained to 28 days before the cut keeps about 90% of its gain, and the gain fades only mildly with lead (C3 -0.62 in week 0 and -0.42 in week 12).
- Every contrast is a level contrast. With each substation-origin-band's mean error removed, all four arms score a mean absolute error of 4.089 to 4.095 (a diagnostic that uses the scored window's own mean).
- The correction fails where the level reverts. Drift lowered the score at only 36 of 57 substation-origin pairs, and raised D10's by +0.52 [+0.11, +0.94] (95%) from the 2024-10 origin on.
- C2's sign pattern is consistent with chance. The origin-level sign test gives p = 0.55, C2 is below zero at 28 of 57 pairs, and C2 does not grow with extra history (Spearman 0.02; -0.054 [-0.193, +0.063] with at least 12 extra months). With levels removed, all history is better by 0.046 on November to March rows and worse by 0.027 on April to October rows. D16 has only 8.4 extra months at the April 2024 origin.
- The earlier sign flips look like level effects. Without drift, C1 per pair correlates 0.82 with the difference in held-level bias, and C1 is about zero once levels are removed. So whether more years help depends on where each substation's next level sits relative to the window average. This experiment does not test the annual frozen fits of experiments 104 and 106 (up to 12 months of stale level, against 3 here), the best form of level correction, weather forecasts, or a replication of experiment 106's design.
- The month-block interval is narrow for this design, because the 3 months of an origin share one fit's level error. The page's intervals use months, as experiment 107 did; the origin-block and pair-block intervals are given above for C2 and C4.
- Triage: all findings accepted. The full report is in the private
briefs/folder (e149_audit_report.md).
Caveats
- Past weather (ERA5 and CAMS) at forecast time is a ceiling, as in experiment 107.
- Five Primaries are scored, with D16 entering at April 2024, so the first three origins hold four substations.
- The 36-month rule does not guarantee 12 extra months of training data. The rule counts calendar months from each substation's first usable date, but training skips the COVID-lockdown window and the switching masks. At the July 2023 origin the all-history window holds only 1.7 extra months at D5, 3.7 at D10, and 6.2 at D11, and none at D14, so C2 compares two identical fits there. Extra history reaches 12 months from the April 2024 origin for D10, D11, D14, and D16, and from July 2024 for D5. Post hoc, over the 8 origins from July 2024 on, C2 is -0.066 [-0.201, +0.052] and C1 is +0.031 [-0.186, +0.228] (98.75%), so the conclusion does not change.
- Quarterly refits and one drift step (3,000, tuned on 2024-07 to 2025-06) are used. Experiment 85 found quarterly refits score worse than weekly refits, so the contrast could change with the schedule.
- The pinned solar capacity of experiment 45 uses a hindsight growth prior at the four burn-in cuts, and the July 2023 cut uses a vintage dated 37 days after it. The burn-in residuals form the spread pools of the first four scored origins. Both arms of every contrast get the same capacity, so the leak is not differential. The as-of capacity of experiment 139 is not used.
- D10's two unlabelled jump windows stay in training, spread pools, and scoring, as in the base variant of experiment 107. Without D10, C2 is -0.076 [-0.173, +0.010].
- The 36-month rule is a choice made before the fits; it leaves out D16's first three origins.
What to try next
- Settle the level-correction question: score a de-levelled error as the primary metric, apply a common causal level correction (the 28-day mean residual) to both window arms, and run both the quarterly and the annual-refit designs over two or more years.
- Rerun C2 with weekly refits and ensemble weather forecasts only if a use needs full history, because the pooled improvement is 3% and the interval spans zero.
- Test whether explicit heating, switching, or pooled terms make long history lower the score. The window alone did not, at these five substations.