Experiment 99: does training on the CRPS of the pooled ensemble forecast beat the pinball loss? (CRPS1 pilot)
Take-home message: training on several ensemble members at once, with a loss that scores their pooled forecast, recovers only about half of the harm that extra members do to the usual loss, so a run on all 51 members is not worth its cost for Primary substations on this evidence. The continuous ranked probability score (CRPS) loss beat the pinball loss, the usual quantile-regression loss, on the same rows by 0.039 points of capacity. One point is 1% of a substation's capacity, and a lower score is better.
Giving the pinball loss 6 ensemble members per run, instead of the control member alone, made it
0.052 points worse. The control member is the ensemble's unperturbed forecast. The CRPS arm
is therefore 0.036 points (95% interval, resampling whole months, -0.022 to +0.111) from the
current recipe, which trains the pinball loss on the control member only. The interval includes
zero, so the pilot cannot say whether the CRPS arm is better or worse than the current recipe. The
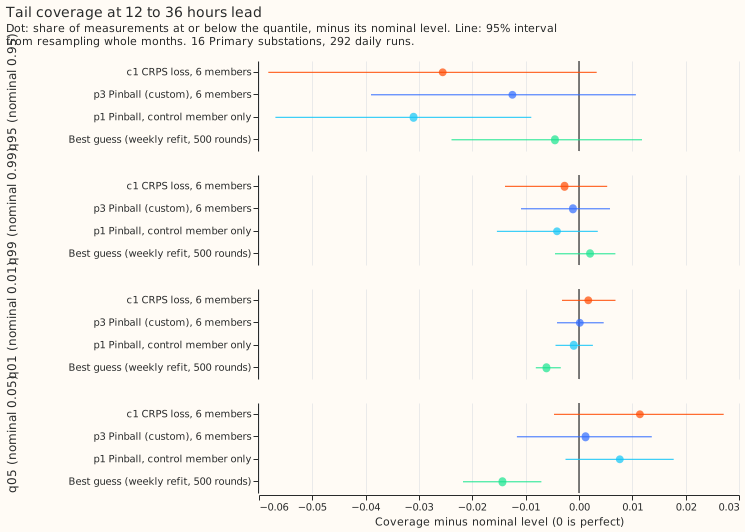
CRPS arm's tails are not within 0.01 of nominal at 12 to 36 hours. The gain from a CRPS-type loss
sits in the median, and the tails need a different fix. The pre-registered verdict, which covers
only the contrast between the CRPS and pinball losses, is small gain.
We asked whether a substation forecast improves when the XGBoost quantile model learns from the ensemble's members jointly. Each daily run gave the control member and 5 drawn members as separate rows. The CRPS arm scores the pooled forecast, which combines the 6 rows' predicted quantiles into one distribution, and the pinball arms score each row alone. All arms refit monthly on a rolling 12-month window with 150 rounds and learning rate 0.15 (a cheap schedule, called P-roll in earlier experiments). They forecast the 292 daily runs of July 2025 to June 2026 at 16 Primary substations, pooling all 51 ensemble members at prediction time.
Results
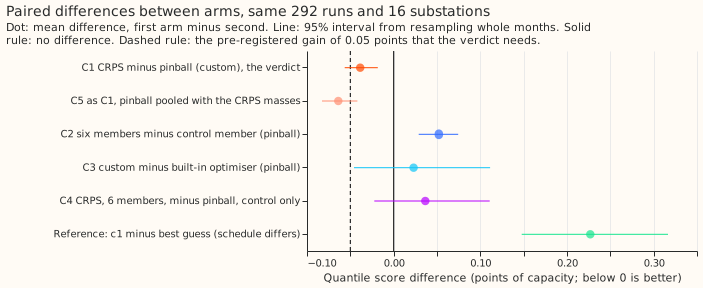
- The CRPS loss beat the pinball loss by 0.039 points of capacity (C1, c1 minus p3, the
verdict): -0.039 (95% interval -0.057 to -0.018),
small gain. The pre-registered threshold needed the interval's upper end below -0.05. With the best guess's spread factor of 1.15 (widening the quantiles about the median by 15%) on both arms: -0.051 (-0.069 to -0.032). - C5, c1 minus p3m: -0.064 (-0.083 to -0.042), where p3m is arm p3's trained XGBoost models pooled with the CRPS atom masses. C5 is larger than C1 because pooling arm p3's pinball atoms with the CRPS masses scores 0.025 points worse.
- Six members as separate rows made the pinball loss worse (C2, p2 minus p1): +0.052 points of capacity (0.029 to 0.074).
- C3, p3 minus p2: +0.023 (-0.046 to +0.111). On the quantile score, the custom optimiser and the built-in one cannot be told apart.
- The CRPS loss on 6 members does not beat control-member pinball training (C4, c1 minus p1): +0.036 (-0.022 to +0.111).
- Reference: c1 is 0.227 (0.148 to 0.317) and p1 is 0.190 (0.131 to 0.251) worse than the best
guess, which refits weekly with 500 rounds; the schedule (weekly refit, 500 rounds) differs, which
probably accounts for this gap. c1 beats the
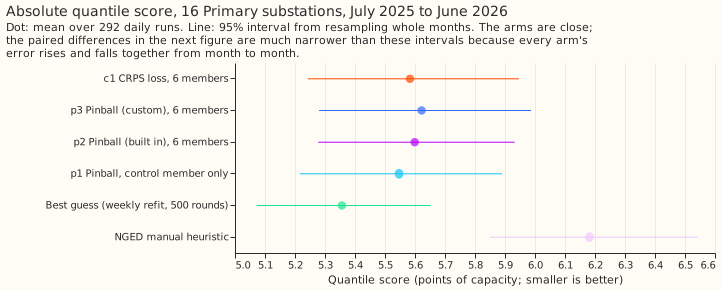
manual_heuristicby 0.598 (0.396 to 0.796). - Absolute scores, all leads (95% interval): p1 5.547 (5.216 to 5.890); p2 5.599 (5.278 to
5.932); p3 5.622 (5.280 to 5.987); c1 5.583 (5.243 to 5.946); best guess 5.356 (5.072 to 5.653);
manual_heuristic6.182 (5.850 to 6.544). - Other scores for C1: the mean absolute error of the median falls by 0.109 (0.066 to 0.149); the threshold-weighted CRPS (which scores only errors beyond a threshold) at the 95th percentile of history rises by 0.008 (0.002 to 0.014); at the 99th and 5th percentiles the change is within noise.
| Tail check, 12 to 36 h | Quantile | c1 | p3 | p1 | Best guess |
|---|---|---|---|---|---|
| Share of actuals below the quantile | 0.01 | 0.012 | 0.010 | 0.009 | 0.004 |
| 0.05 | 0.061 | 0.051 | 0.058 | 0.036 | |
| 0.95 | 0.924 | 0.938 | 0.919 | 0.945 | |
| 0.99 | 0.987 | 0.989 | 0.986 | 0.992 | |
| Pinball loss at 0.95 (points of capacity, 100 times the script's printed fraction) | 0.95 | 1.32 | 1.28 | 1.18 | 1.09 |
Caveats and next steps
- Schedule: monthly P-roll with 150 rounds, not the weekly production recipe, so the absolute scores cannot be compared with the best guess's. The contrasts C1, C2, C3, and C5 hold the schedule fixed; whether they depend on it is untested.
- Pilot limits: 6 members per run at training (51 at prediction), every third daily run, and 16 Primary substations. A run on all 51 members could behave differently, and the pilot cannot say how.
- Tuning: the constant Hessian (10, the constant second-derivative value that the custom objectives hand to XGBoost) was chosen on four substations and January to March 2025, inside the training period. Both custom arms share it; its best value for each loss may differ. The level weights of the CRPS gradient are divided by twice the atom mass, so c1 is a preconditioned CRPS gradient with the same fixed point.
- Not scored: the curtailment-cost metric covers supply points with generators behind them, and this pilot trains Primary substations only. Climatology is left out because its rows stop short of the longest leads, so including it would drop 5% of the rows from every arm.
- Rows: all arms and the stored best guess share 3,197,611 forecast rows.
- Interval width: the intervals resample 12 origin months, so they may be a little narrow. The upper end of C1's interval, -0.018, is far from the -0.05 threshold, so the verdict does not depend on it.
- Compute: 1.55 GPU hours of wall-clock time, up to 10 worker processes of one thread each.
- Options for later: a tail-specific spread factor on the best guess, or pooled-member spread statistics as input columns, because this pilot moved the centre of the distribution and left the tails where they were.
Tuning the constant Hessian (training period only)
Each custom arm was fitted at a refit on 2025-01-01 at four Primary substations and scored on the 6-member rows of runs from 2025-01-02 to 2025-03-31 that the fit had not seen. The table gives the mean quantile score (points of capacity, pooled over 6 members) and the coverage of the 0.05 and 0.95 quantiles. Arms p3 and c1 share one Hessian, 10, the lowest score for both. The built-in pinball arm p2 scored 3.640 on the same rows. These numbers are not results of the experiment.
| Hessian per row and level | p3 score | c1 score | p3 q05 / q95 | c1 q05 / q95 |
|---|---|---|---|---|
| 5 | 3.818 | 3.797 | 0.099 / 0.918 | 0.150 / 0.897 |
| 10 | 3.767 | 3.748 | 0.069 / 0.930 | 0.089 / 0.917 |
| 20 | 3.815 | 3.782 | 0.033 / 0.944 | 0.038 / 0.939 |
| 40 | 4.085 | 4.050 | 0.014 / 0.952 | 0.014 / 0.950 |