Experiment 89: does the longest history, with load shifts masked, improve the NRA forecast?
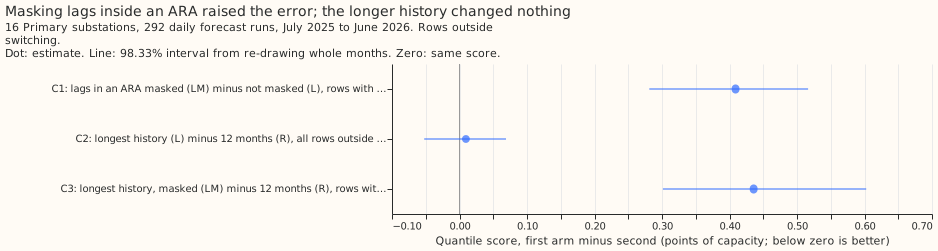
Take-home message: hiding the past power readings (lags) that were measured while the electricity network was switched away from its normal arrangement made the demand forecast for Primary substations (the substations that step down to the local distribution network) worse, and training on all history since March 2021 instead of the last 12 months changed nothing. Removing the switched half-hours from the training targets therefore did not make the longer history help, so the labelled switching we have does not explain why a long history fails to help demand forecasts. The masking raised the error by 0.409 points of capacity (98.33% interval +0.281 to +0.517) on the half-hours whose lags were measured during switching. The longest history scored 0.009 points worse than the 12-month window (-0.052 to +0.069). The next step is to test whether a label that marks fewer half-hours lets masking help, using injected events of known size. The verdict is refuted: the plan called a masking interval wholly above zero a refutation.
An electricity network operator sometimes moves load between substations by closing a normally open switch. We call the period while the network is switched away from its normal arrangement an abnormal running arrangement (ARA). NGED, the network operator, supplied the data, and NRA means normal running arrangement. We asked two questions of an XGBoost demand model for 16 Primary substations. First, with ARA half-hours removed from the training targets, does training on all history since March 2021 beat training on the last 12 months? Second, does setting to missing every past power reading (lag) that was measured inside an ARA lower the error on forecasts that use such a lag? We refitted the model monthly and scored 292 daily forecast runs from July 2025 to June 2026 on half-hours outside every ARA. The ARA is the union of the intervals of the refit-offset neighbour-count (RO-NC) detector, NGED's logged events, and NGED's logged closures. The score is the quantile score in points of capacity (smaller is better).
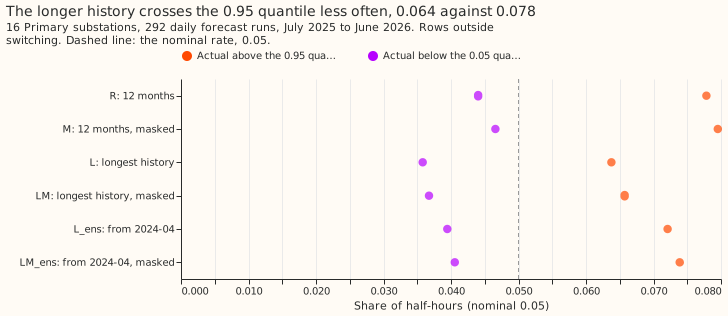
- Arms. R: last 365 days, recency half-life 0.5 years, lags unmasked. M: R with lags in an ARA set to missing. L: all rows since 2021-03, half-life 2 years, lags unmasked. LM: L with masked lags. L_ens and LM_ens: L and LM using only runs from 2024-04-01. Every arm drops training rows whose target is inside an ARA. Monthly refits, 150 rounds, eta 0.15, control member only, seed 0.
- Rows. 3,199,243 forecast cases (one substation, one forecast run, one lead time); 2,704,935
outside every ARA (the scored rows), of which 352,765 (13.0%) have a lag inside an ARA (the
headline rows) and 30,950 have a lag inside a logged event. Row set
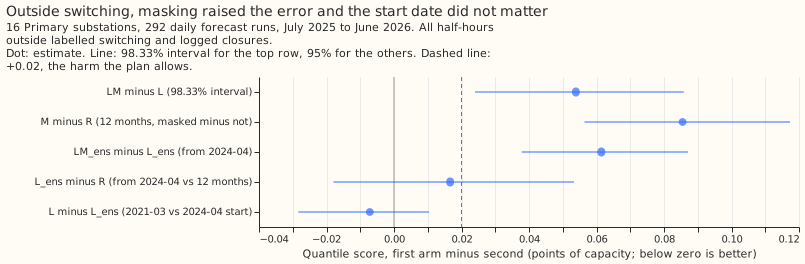
fold_a_daily_gap_v1. - Planned contrasts (98.33%). C1, LM minus L, rows with a lag in an ARA: +0.409 (+0.281 to +0.517). C2, L minus R, all rows outside switching: +0.009 (-0.052 to +0.069). C3, LM minus R, rows with a lag in an ARA: +0.436 (+0.301 to +0.603). No-harm check, LM minus L, all rows outside switching: +0.054 (+0.024 to +0.086), above the +0.02 margin.
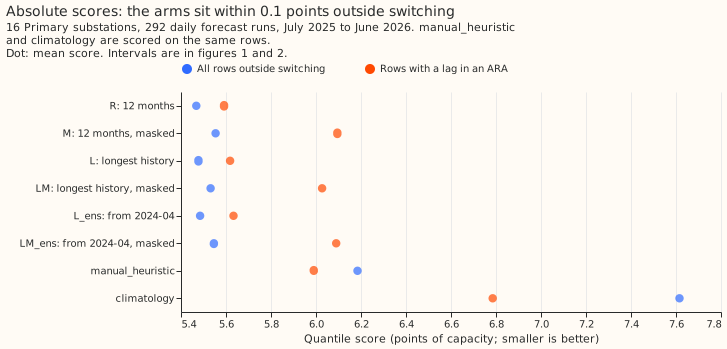
- Absolute scores, all rows outside switching. R 5.468, L 5.478, L_ens 5.485, LM 5.531, LM_ens
5.546, M 5.554;
manual_heuristic6.184;climatology7.616. - Absolute scores, rows with a lag in an ARA. R 5.591, L 5.618, L_ens 5.633, LM 6.027, LM_ens
6.090, M 6.095;
manual_heuristic5.990;climatology6.785. Masking pushed the XGBoost model behindmanual_heuristicon these rows. - Descriptive contrasts (95%). M minus R: +0.504 (+0.407 to +0.611) on rows with a lag in an ARA, +0.086 (+0.056 to +0.117) elsewhere. LM_ens minus L_ens: +0.456 (+0.332 to +0.566) and +0.061 (+0.038 to +0.087). L_ens minus R: +0.017 (-0.018 to +0.053). L minus L_ens: -0.007 (-0.028 to +0.010). LM minus L on the 30,950 rows with a lag in a logged event: -0.038 (-0.652 to +1.927).
- Tails, all rows outside switching (share of actuals below the 0.05 quantile and above the 0.95 quantile, nominal 0.05): R 0.044 and 0.078; L 0.036 and 0.064; LM 0.037 and 0.066; M 0.047 and 0.080. Pinball loss at 0.05 and 0.95: R 0.912 and 1.202; L 0.899 and 1.185. The longer history crossed the 0.95 quantile less often and scored a little better in the tails, though the quantile score did not move. The nine quantile levels have no 0.01 or 0.99.
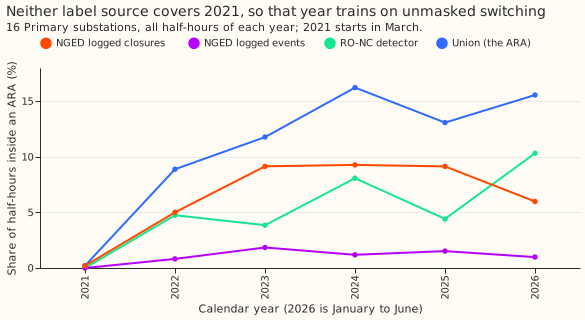
- Labelled switching per year (share of half-hours inside an ARA, all 16 series): 2021 0.2%, 2022 8.9%, 2023 11.8%, 2024 16.2%, 2025 13.1%, 2026 (January to June) 15.6%. None of the three sources labels most of 2021, so the first 10 months of training history keep their switching in the targets.
- Schedule. Monthly refits, which the 12-month and longest-history arms share. A weekly schedule was not run, and the history contrast could depend on it.
- Weather. The forecast's own control-member weather at forecast time; nothing from ERA5. The control member is 18 km before 2023-06-27 and 9 km after, and the archive from 2024-04-01 is a different product. L_ens and LM_ens (runs from 2024-04-01) scored within 0.02 of L and LM outside switching, so the seam did not decide the contrasts.
- Curtailment cost. Not scored: this experiment forecasts Primary demand only and has no generator forecasts for the node metric.
- Caveats. Masks use hindsight labels, so C1 and C3 are the best masking could do for an event known only afterwards. L differs from R in window and half-life together, and L_ens separates them only partly. Possible reasons for the harm (not tested): the union marks 9 to 16% of half-hours per year from 2022, so masking discards a good lag on many rows, and a missing lag leaves the model with no recent anchor.
- What to try next. Test masking with a tighter label (logged events only, 30,950 rows), or replace a masked lag with a forecast of the normal arrangement, both on injected switches whose truth is known (experiment 88 injects them).