Experiment 86: do the detector's load-shift labels give the same gain as NGED's logs?
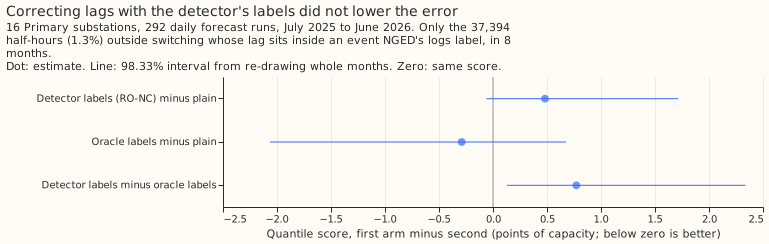
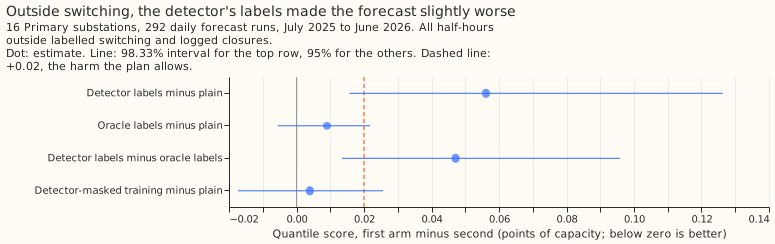
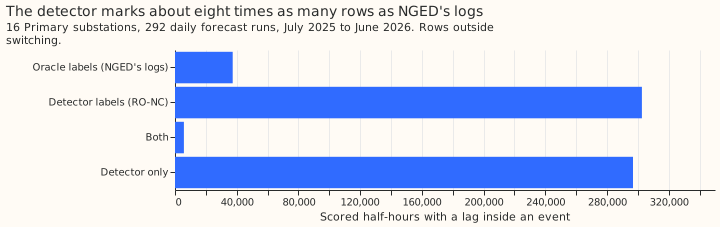
Take-home message: correcting each past power reading (a lag) for switching did not lower the error of the XGBoost demand forecast for Primary substations with either source of labels, and the detector's labels raised the error slightly on all rows outside switching. Here "oracle labels" are the switching events in NGED's logs, and "detector labels" are the events found by a detector that reads no log. On the half-hours whose lag falls inside a logged event, the oracle labels changed the quantile score by -0.29 points of capacity (98.33% interval -2.06 to +0.68), and the detector labels by +0.48 (-0.06 to +1.72). On all half-hours outside switching, the detector labels changed the score by +0.056 (+0.016 to +0.126). The detector marks 8.1 times as many half-hours as the logs and marks only 15% of the half-hours the logs mark. These data cannot show whether the detector or the logs is wrong where they disagree. Eight months of in-event half-hours are too few to show a gain even for the logs. One option for a next experiment is to inject switching events of known size and test whether the corrected-lag forecast recovers the true normal running arrangement. The verdict is inconclusive.
An electricity network operator sometimes closes a normally open switch, so that one Primary substation (a substation that steps down to the local distribution network) carries load that belongs to a neighbour. A forecast of the normal running arrangement (NRA) matters most for two cases: half-hours whose lags were measured during such a switch, and forecasts made while a substation is in an abnormal arrangement. We asked whether subtracting the moved MW from each lag, and giving the moved MW to XGBoost as three more columns, lowers the error. We tried it with the events in NGED's switching logs (oracle labels) and with the events found by the RO-NC load-transfer detector of experiment 82. The detector reads no log.
We refitted the XGBoost demand model monthly on a rolling 12-month window (experiment 49's cheap schedule) for 16 Primary substations, and scored 292 daily forecast runs from July 2025 to June 2026. The score is the quantile score in points of capacity, where smaller is better.
- Arms (experiment 75's inputs, seed 0).
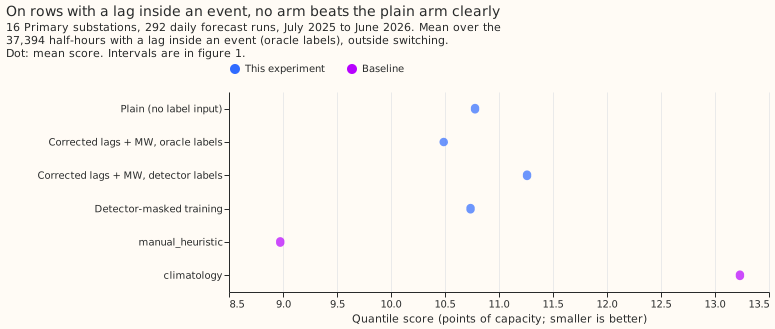
plain: all rows, no label input.lagmw_oracle: lags minus the signed MW plus three MW columns, oracle labels, trained on all rows.lagmw_xl: the same inputs with the detector's (RO-NC) labels.mask_xl: training rows inside an RO-NC event dropped (descriptive). - Rows. 3,199,243 cases, of which 2,928,842 lie outside switching (oracle events and logged closures). The headline rows are the 37,394 of those (1.3% of the 2,928,842, in 8 months) with a lag inside an oracle event.
- Score on the headline rows (
plain/ oracle / RO-NC /mask_xl): 10.778 / 10.488 / 11.260 / 10.736.manual_heuristicscores 8.975 andclimatology13.231 on the same rows. - Score on all rows outside switching: 5.408 / 5.417 / 5.464 / 5.412.
manual_heuristic6.121 andclimatology7.479 (on slightly fewer rows). - Contrasts (98.33% intervals). C1 +0.48 (-0.06 to +1.72). C2 -0.29 (-2.06 to +0.68). C3, the skill lost without NGED's logs, +0.77 (+0.13 to +2.34). The share of the oracle gain recovered is not defined, because C2 is not a gain. N1, C1 on all rows outside switching, +0.056 (+0.016 to +0.126): its upper end exceeds the +0.02 margin.
- Descriptive contrasts (95%).
lagmw_xlminusplainon the 296,878 rows with a lag inside an RO-NC event only: +0.47 (+0.24 to +0.84), which is the harm from detector labels the logs do not confirm.lagmw_oracleminusplainon all rows outside switching: +0.009 (-0.006 to +0.022).mask_xlminusplainoutside switching: +0.004 (-0.017 to +0.026); on the headline rows -0.042 (-0.084 to -0.008). - Tails (coverage of the 5%-to-95% band, nominally 90%; pinball loss at 0.05 and 0.95, in
points). Outside switching,
plain0.893, 0.914, 1.162; oracle 0.892, 0.913, 1.161; RO-NC 0.885, 0.929, 1.181. On the headline rows,plain0.784, 1.506, 3.386; oracle 0.750, 1.498, 3.385; RO-NC 0.721, 1.808, 3.424. The 0.01 and 0.99 quantiles are not stored (nine levels). - Label coverage. Rows outside switching with a lag inside an event: 37,394 by the logs, 302,619 by the detector, 5,741 by both. The detector may be marking real transfers that NGED did not log, which these data cannot tell apart from false alarms.
- Caveats. Both label sources use hindsight: an event's end is known up to 14 days later. C3 therefore compares like with like, but the absolute gain is not what a live service would get. The headline rows are few and fall in 8 months, so the intervals are wide. There is one seed. The detector's signed MW is the substation's own 24-hour residual step, not a logged MW. Where both sources label a half-hour, the correlation is weak (0.19 at the only substation where it could be computed).
- Models kept. All 768 boosters (4 arms, 12 monthly refits, 16 substations) are saved under
data/ml-experiments/00086-sw2-12-detector-labels-for-nra-forecast/work/boosters/<arm>/for the follow-up that injects switching events. - What the next experiment should answer. Whether the corrected-lag forecast recovers the true normal running arrangement when switching events of known size are injected into the lags, so that the in-event rows are numerous enough to measure.