Experiment 81: do the weekly-retraining findings hold on a second set of forecast runs, July 2023 to March 2024?
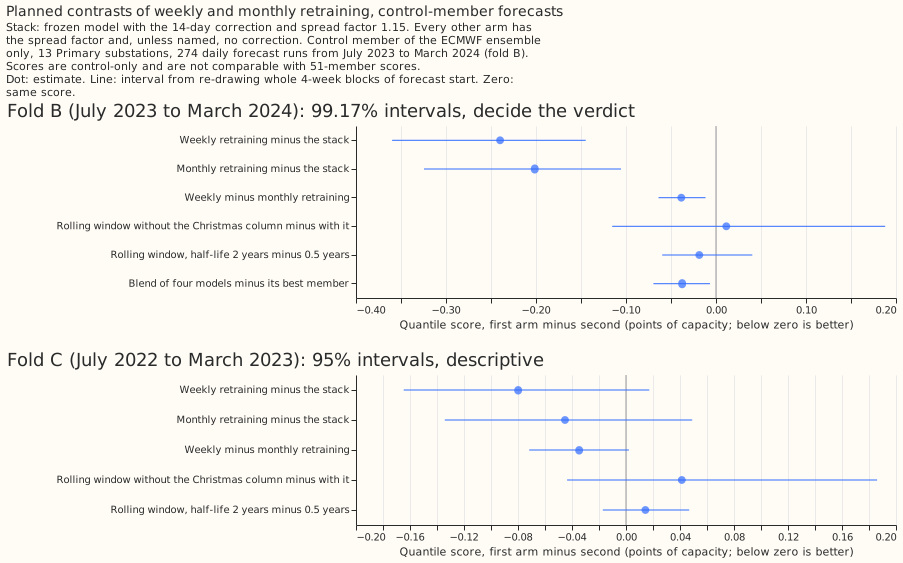
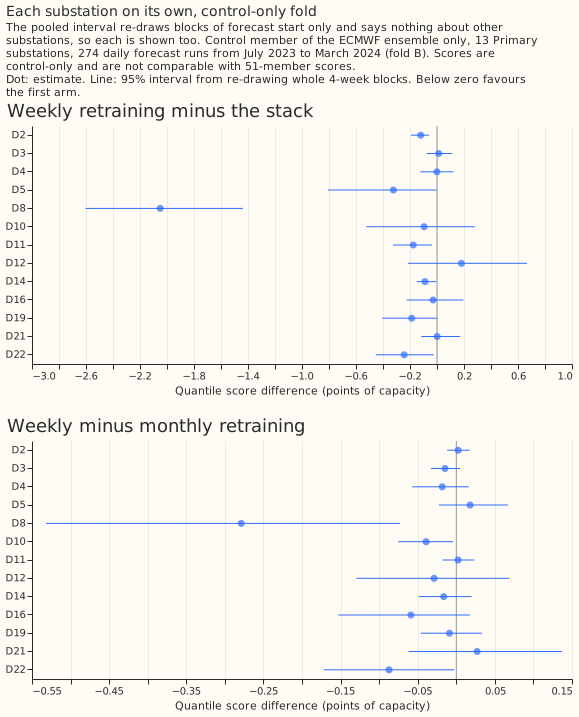
Take-home: refitting the XGBoost demand model every week, with no error correction, scored better than the stack again, on forecast runs from a different period, by 0.24 points of capacity (experiment 48 found 0.20), so the case for porting weekly retraining now rests on two periods. The stack is an XGBoost model fitted once, with a 14-day correction built from its recent errors. The gain is concentrated: without three substations (D8, D12, and D5, which carried experiment 48), it is 0.09 points (95% interval -0.19 to -0.01). Weekly retraining beat monthly retraining by 0.04 points. The four-model blend gained a further 0.04 points, short of the 0.05 needed to justify serving it. The verdict is supported.
We scored the Primary demand forecasts of 13 substations (the 16 of experiments 48 and 49 less three with no data in the period) on 274 daily runs from 2023-07 to 2024-03. For those runs the project holds only the control member of the ECMWF ensemble (ENS), so every number is a control-only number and no absolute score is comparable with experiments 48 or 49. The error is the quantile score in points of capacity (1 point is 1% of a substation's capacity); smaller is better. The weather product changed from 18 km to 9 km resolution on 2023-06-27, which matters below.
- Arms: the stack; weekly, monthly, and rolling-12-month refits (half-life 0.5 years, which
halves the weight of data every half year; no correction); rolling without the Christmas column
(the input counting days to 25 December); rolling with a 2-year half-life; a blend of weekly,
monthly, rolling, and stack. Baselines:
manual_heuristicandclimatology. Every arm uses a spread factor of 1.15 that widens its quantiles. - Rows: fold B is
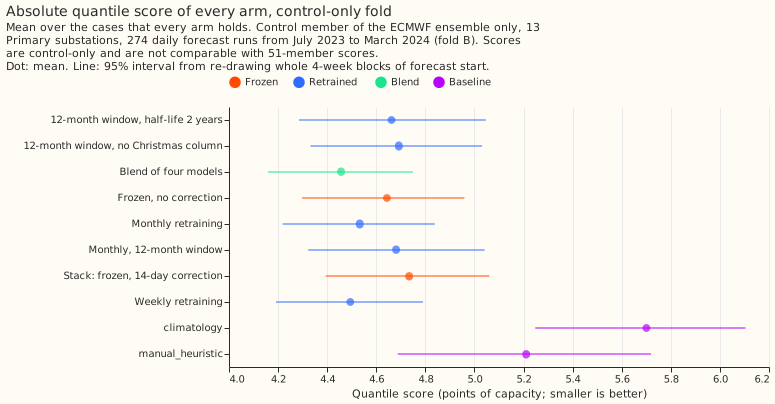
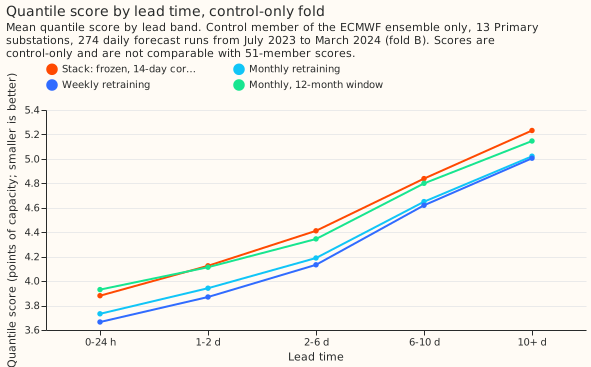
control_fold_b_daily_v1(274 runs, 2023-07-01 to 2024-03-31, 9 km). Fold C iscontrol_fold_c_daily_v1(273 runs, 2022-07-01 to 2023-03-31, 18 km, 15 months of training history). Seed 0. Intervals use 4-week blocks of forecast start (10 blocks). - Absolute scores, fold B: blend 4.457, weekly 4.494, monthly 4.533, rolling 4.681, stack
4.734,
manual_heuristic5.211,climatology5.700 (95% intervals plus or minus 0.3 to 0.5). Fold C: weekly 4.020, monthly 4.054, rolling 4.073, stack 4.100,manual_heuristic4.845,climatology6.099. - C1, weekly minus the stack: fold B -0.240 (99.17% interval -0.360 to -0.145; 95% t-interval over months -0.359 to -0.121). Fold C -0.080 (-0.187 to +0.051). Without D8, D12, and D5 (the series with data in each fold), fold B is -0.093 (95% -0.189 to -0.014) and fold C -0.084 (-0.170 to +0.018). D8 alone gains 2.05 (95% -2.60 to -1.44).
- C2, monthly minus the stack (descriptive): fold B -0.201 (-0.324 to -0.105); fold C -0.045 (-0.162 to +0.082). Most of C1 is therefore retraining against the stack, not weekly against monthly.
- C3, weekly minus monthly: fold B -0.039 (-0.064 to -0.012; the t-interval, -0.078 to -0.000, only just excludes zero). Fold C -0.035 (-0.085 to +0.014).
- C4, rolling without the Christmas column minus with it: fold B +0.011 (-0.115 to +0.188), fold C +0.041 (-0.054 to +0.252), unresolved. Inside 2023-12-18 to 2024-01-04, dropping the column raised the score by 1.20 points, against -0.07 outside the window; the winter before, +1.79 against -0.08. January alone favoured dropping it (-0.099, -0.184 to -0.020). Pooled over three winters with experiment 49's, the contrast is -0.013 (-0.037 to +0.010), dominated by experiment 49's narrow interval. We keep the column.
- C5, half-life 2 years minus 0.5 years: fold B -0.019 (-0.060 to +0.040), fold C +0.014 (-0.027 to +0.058), unresolved.
- C6, blend minus weekly: -0.038 (-0.070 to -0.007), a small gain that misses the -0.05 threshold. The blend has four members; experiment 49's had five.
- Correction and spread: the 14-day correction did not help the frozen model (+0.091, -0.005 to +0.187, a worse score whose interval includes zero). The exceedance rate of the 0.95 quantile (nominal 0.05) is 0.052 for weekly with the spread factor and 0.073 without it. Re-choosing the factor on the first three months (1.10) changed later scores by +0.002.
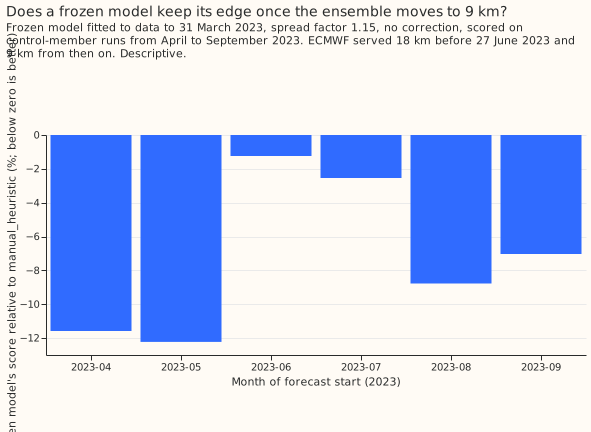
- 9 km check (descriptive): the frozen model beat
manual_heuristicby 9.1% on runs before 2023-06-27 (18 km) and by 6.3% after, but the monthly figure swings from 11.6% (April) to 1.2% (June) to 8.8% (August), so the drop is within the seasonal swing. We predicted that weekly retraining's gain over the stack would grow late in the fold as 9 km data accumulates; C1 by month went the other way (-0.552 in December, -0.381 in January, -0.147 in February, -0.137 in March). The experiment found no evidence of adaptation to the 9 km product and could not rule it out. - Caveats: neither fold can separate retraining from adaptation to a weather product, and fold C also confounds the all-18 km period with a short history. The effective capacities, which scale the scores and the inputs, come from the stage 1 pilot's table built from all data, not fitted before each fold. The spread check chose its factor on cases whose targets reach 14.6 days into the first scored month. The pooled read (R-b) treats two periods as independent although both score the same 13 substations, which exclude series 7, 13, and 12 (no data in the period).
- More history or the full ensemble? More history would narrow C4 and C5, whose intervals include zero in both folds, and a longer run on one weather product would test the 9 km confound. This experiment did not test whether full-ensemble features (spread, CRPS) change any contrast, because only the control member exists for these runs.
- Next: the solar and analogue contrasts of experiments 64, 78, and 74 need April-to-September rows with a control-only sunshine anomaly. Fold B has 92 such days and no April to June, so this experiment did not run them.