Experiment 52: do more weather forecasts lower the wind farms' error at 1 to 2 days ahead?
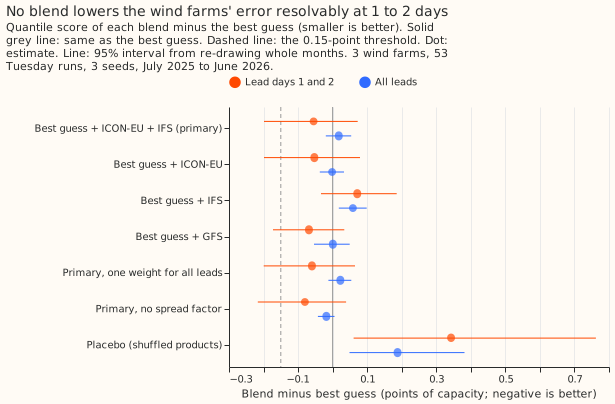
Averaging the wind best guess with two extra weather forecasts did not resolve any gain at 1 to 2 days ahead. The best guess is the quantile forecast of wind-farm power from experiment 33. It is built from the 51 members of the European Centre for Medium-Range Weather Forecasts (ECMWF) ensemble forecast (ENS) and a wind-power model trained on ERA5, the ECMWF estimate of past weather. We fed that wind-power model the 100 m wind forecast of ICON-EU (the German weather service's regional weather model) and of the ECMWF high-resolution forecast (IFS, on a 0.25 degree grid). We then averaged each quantile with the best guess's, using weights chosen only on earlier months. Over the three metered wind farms, the average scored 0.055 points of capacity better (a lower quantile score is better) than the best guess at lead days 1 and 2. The 95% interval, -0.200 to +0.072, includes zero, so the experiment cannot say whether the extra forecasts help.
Inconclusive: at lead days 1 and 2, the primary blend (the best guess averaged with ICON-EU and
IFS) scores 0.055 points of capacity better, with a 95% interval of -0.200 to +0.072. A lead day
counts calendar days from the date of the ENS run, so lead days 1 and 2 are the two days after the
run's date. This decisive contrast (C1) must lie wholly below -0.15 for the verdict supported. The
same contrast over all leads (C2) is +0.018 (-0.020 to +0.054) and does not change the verdict. The
intervals resample whole months and the three seeds, so they describe these three farms and cannot
speak for other farms. The prediction (-0.2 to -0.4 at days 1 and 2) was too large.
Absolute scores
The blend scores 0.055 points better at lead days 1 and 2, 0.122 worse at days 3 to 6 (because of the spread factor), and the same from day 7, where no product exists. The quantile score is twice the mean pinball loss over nine quantile levels, in points of capacity (smaller is better). Coverage is the share of cases inside the 5% to 95% band, which is nominally 0.90. At lead days 1 and 2 the share of cases above the 0.95 quantile is 0.053 for the best guess and 0.056 for the blend. The cases are three farms, three seeds, and the 53 Tuesday runs from July 2025 to June 2026.
| Scope | Best guess | Primary blend | Cases | Coverage, best guess | Coverage, blend |
|---|---|---|---|---|---|
| Lead day 0 | 6.722 | 6.525 | 13,695 | 0.902 | 0.903 |
| Lead days 1 and 2 | 6.701 | 6.646 | 44,328 | 0.909 | 0.901 |
| Lead days 3 to 6 | 9.702 | 9.824 | 88,716 | 0.909 | 0.917 |
| Lead days 7 and later | 13.154 | 13.154 | 174,624 | 0.916 | 0.916 |
| All leads | 11.037 | 11.054 | 321,363 | 0.912 | 0.914 |
Per farm, the two arms differ by at most 0.07 points over all leads. The best guess scores 10.67, 12.38, and 10.06 at W1, W2, and W3, and the primary blend 10.68, 12.36, and 10.13.
What else the numbers show
All reads in this section are exploratory.
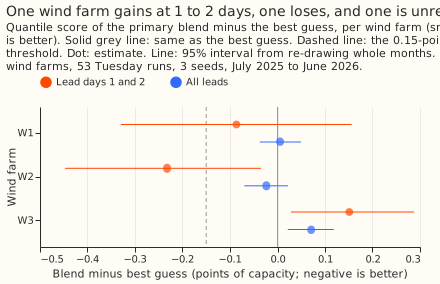
- The farms disagree at lead days 1 and 2. The primary blend minus the best guess is -0.087 (-0.330 to +0.156) at W1, -0.233 (-0.447 to -0.035) at W2, and +0.151 (+0.028 to +0.287) at W3.
- The blend scores worse at lead days 3 to 6 only because of the spread factor. The primary blend minus the best guess is +0.122 (+0.028 to +0.221) at days 3 to 6, and +0.005 (0.000 to +0.016) without the spread factor. From August the chosen weights there are 1, 0, and 0, so the blend equals the best guess, but the spread factor (1.65 in August, 1.35 in September, 1.2 in October) was fitted on earlier months blended under other weights. At day 0 the contrast is -0.197 (-0.460 to +0.051).
- At day 0, 8 of the 16 blend contrasts exclude zero. They are all four with GFS, the two one-weight arms with ICON-EU alone, and the two one-weight arms with ICON-EU and IFS. The best guess averaged with the US Global Forecast System (GFS), also from the Open-Meteo archive, scores -0.229 (-0.371 to -0.090). These reads are many, correlated, and chosen after the fact.
- No single extra product resolves a gain at lead days 1 and 2. The best guess averaged with ICON-EU only gives -0.053 (-0.199 to +0.079), with IFS only +0.071 (-0.034 to +0.185), and with GFS only -0.069 (-0.172 to +0.034). The IFS arm with one weight is worse, +0.101 (+0.036 to +0.194).
- Each product's own forecast is far worse than the best guess at lead days 1 and 2. With a spread factor (a multiplier that widens each quantile band about its median), ICON-EU's own forecast scores 2.469 points worse, IFS's 1.264, and GFS's 1.853. The wind-power model receives raw product winds with no bias correction, so the gap may reflect that mismatch and not only the ensemble's advantage; the experiment does not test which.
Over the first 6 months, the plan's stop rule (drop any product more than 1.0 points worse) fired for all three products. The exploratory arms ran for all three products anyway, and the primary arm was fixed before the run. - At lead days 1 and 2, the chosen weights stayed mostly on the best guess. Averaged over the scored months, days 1 and 2 gave 0.72 to the best guess, 0.24 to ICON-EU, and 0.05 to IFS. Day 0 gave 0.51, 0.34, and 0.15. Days 3 to 6 gave 0.94, 0.03, and 0.03, which is 1, 0, and 0 in every month from August; July, with no history, used equal weights. One weight for all leads (-0.060, -0.200 to +0.065, at days 1 and 2) scored about the same as weights per lead band (-0.055). - Widening the quantile bands with a spread factor did not help. Without it, the primary blend minus the best guess is -0.080 (-0.217 to +0.039) at lead days 1 and 2 and -0.018 (-0.043 to +0.005) over all leads. The factors ranged 1.0 to 1.25 for days 0 to 2 and 1.0 to 1.65 for days 3 and later. - The placebo passes: weight selection rejected the shuffled forecasts, and its positive score comes from two other steps. The placebo shuffles the product forecasts among cases of the same farm, month, lead day, and time of day. In every month after July the chosen weights are 1, 0, and 0, so the placebo equals the best guess apart from July (equal weights, no history) and the spread step. It scores +0.343 (+0.061 to +0.762) at lead days 1 and 2.
How the experiment was run, and where it departs from the plan
- Cases and benchmark: the 53 Tuesday runs of experiment 33's wind best guess (
bg_full), three farms and three seeds, scored on its stored half-hourly cases. The farms are labelled W1 to W3. - Product age:
previous_day(d+1)selects runs about half a day older than the ENS run (0 to 24 hours older, depending on the hour of day). The service reads at 09:00 UTC, so the 00 UTC runs of ICON-EU and IFS from the ENS run's own date would be available. The experiment therefore tests deliberately aged products, which rules out lookahead and handicaps the products. - July: July 2025 has no earlier months, so it uses equal weights and no spread factor. At lead days 1 and 2 the primary blend minus the best guess is +0.188 in July, against a mean of -0.070 over the other eleven monthly differences, and July's cases shape the factors of August onwards.
- Product forecast: experiment 33's ERA5-trained wind-power model, refitted per seed on valid
times before 2025-06-17, fed each product's wind at the farm's grid point from Open-Meteo's
Previous Runs archive. A case at lead day d reads
previous_day(d+1), which the archive defines as a run initialised at least that many days before the hour, so the run was initialised no later than 00 UTC on the ENS run's date. The experiment did not check that definition against the archive itself; the matched-lead study checked it on GFS for 2 days. A case beyond a product's horizon (ICON-EU after lead day 3) or with a missing value keeps the best guess. - Blend: the average of each quantile level, with weights on a grid of quarters chosen per lead band on earlier months only, then a spread factor fitted on earlier cases. The spread factor is fitted for lead days 0 to 2 pooled and days 3 and later pooled, so that each fit has enough cases; the plan said per lead band. A half-hour valid time takes its speed and direction from the averaged east-west and north-south wind components of the two hours either side.
- Not run: the solar arm (the matched-lead study found no solar gain at this lead), AIFS (the ECMWF machine-learning forecast, which needs its own rows because its weather-model version changes over time), and the climatology row.
- ICON-EU's mean 100 m wind speed is highest (8.90 m/s) and IFS's lowest (7.56), against 8.18 for ERA5. GFS is 8.00. Each product's mean covers only the cases it covers, so the comparison flags a bias without measuring it. ICON-EU's 100 m wind is Open-Meteo's rescaling of its 120 m level.
- The plan and code reviews found no leakage. The Sonnet code review noted that the availability
check in
e00052_fit.pycannot fire, because the lead rule already guarantees availability. Code:ml-experiments/00052-more-nwp-products-for-wind-farms/.
What the next experiment should answer
Whether the products help when read at the service's own time. The next experiment should feed the 00 UTC runs of ICON-EU and IFS from the ENS run's own date, correct each product's wind speed for bias, and fit the spread factor on blends made under the same weights. A day 0 test needs more wind farms than the three metered ones can supply, and the day 0 reads here (GFS in particular) were generated after the fact, so a confirmation must name them in advance.