Experiment 17: training window, recency, and retraining rule for demand
We asked whether a demand model forecasts better when it is trained only on recent data, retrained often, or corrected using its recent errors. We tested these rules on 16 Primary substations (substations that step power down to the local distribution network), with monthly forecasts from January 2022 to June 2026. Every rule that follows recent data beat training on all history, and a correction using the previous 14 days of errors beat all of them. The tests used estimates of past weather in place of weather forecasts, so the scores are a ceiling on what these rules would reach with weather available at forecast time.
Supported: every rule that follows recent data beat all history, and the 14-day correction beat
all of them. Scores are the mean absolute error of the median in points of capacity (1 point is 1%
of a series' effective capacity), on 16 Primary substations, with monthly forecasts from January
2022 to June 2026 (1.07 million half-hours). Weather is ERA5 (a reanalysis, an estimate of past
weather), which arrives about 5 days late, so the scores are a ceiling on what forecast-time weather
reaches. The fitting code is in ml-experiments/00017-*/; the sliding windows are 183, 365, and 548
days. The mean absolute error of the median is the average gap between the median forecast and the
measured power.
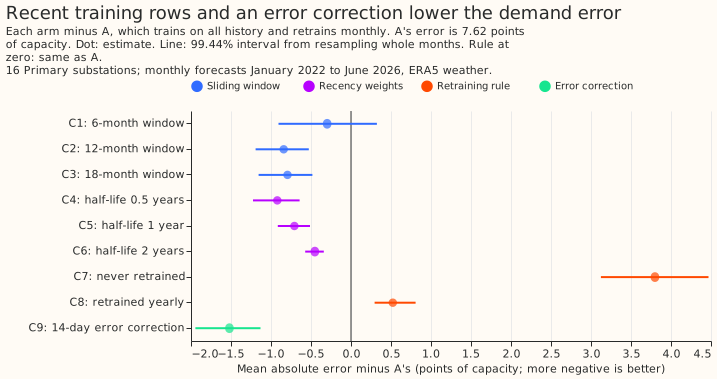
| Arm | Error (95% interval) | Against A (99.44% interval) |
|---|---|---|
| A: all history, monthly retrain | 7.62 (7.28 to 7.98) | reference |
| W6: 6-month window | 7.32 (6.97 to 7.70) | -0.30 (-0.91 to +0.32) |
| W12: 12-month window | 6.77 (6.48 to 7.11) | -0.84 (-1.19 to -0.53) |
| W18: 18-month window | 6.82 (6.52 to 7.17) | -0.79 (-1.15 to -0.48) |
| H0.5: half-life 0.5 years | 6.70 (6.42 to 7.00) | -0.92 (-1.22 to -0.64) |
| H1: half-life 1 year | 6.91 (6.63 to 7.23) | -0.71 (-0.92 to -0.51) |
| H2: half-life 2 years | 7.16 (6.86 to 7.50) | -0.45 (-0.57 to -0.34) |
| F: never retrained | 11.42 (10.86 to 12.02) | +3.80 (+3.12 to +4.47) |
| Y: retrained yearly | 8.14 (7.76 to 8.54) | +0.52 (+0.30 to +0.81) |
| K: A plus 14-day correction | 6.10 (5.88 to 6.32) | -1.52 (-1.95 to -1.13) |
| Month-by-half-hour climatology | 8.44 (8.02 to 8.88) | not paired |
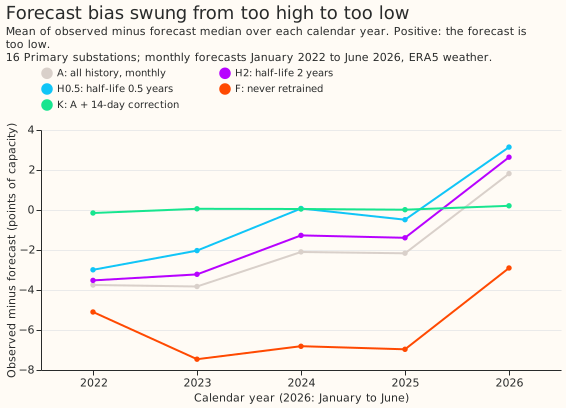
The drift reverses sign, and that is why recent rows win. A's mean error (observed minus forecast) runs from about -3.8 points in 2022 and 2023 (forecast too high) to +1.8 in the first half of 2026 (forecast too low). In 2026 the 12-month window and the half-lives overshoot to +3.0 to +3.4, yet still score 8.3 to 8.6 against A's 9.4. Only the 6-month window and the correction stay near zero, the correction within 0.2 points in every year (figure 2).
Three predictions missed, and one held with a larger size. The recency and correction gains were 0.5 to 1.5 points, against the 0.1 to 0.3 predicted. The 6-month window lowered the error by 0.3 points where a rise was predicted, though its interval straddles zero. The frozen XGBoost model raised the error by 3.8 points, which meets the predicted rise of at least 0.5 and exceeds it.
Failures and limits. No fit failed. The correction needs observed power 2 days old, so it is only as good as the live telemetry delay. All scores use ERA5 weather.
Post hoc contrasts
The correction stacks with shorter memory. The correction applied to H0.5 scores 5.82 (95% interval 5.63 to 6.02), 0.27 points (0.21 to 0.34) below the correction on A. Applied to W12, it scores 5.84. These contrasts were not pre-registered.