Data Quality Challenges
NGED's distribution-level data is considerably messier than transmission-level data. Key issues observed in the trial area:
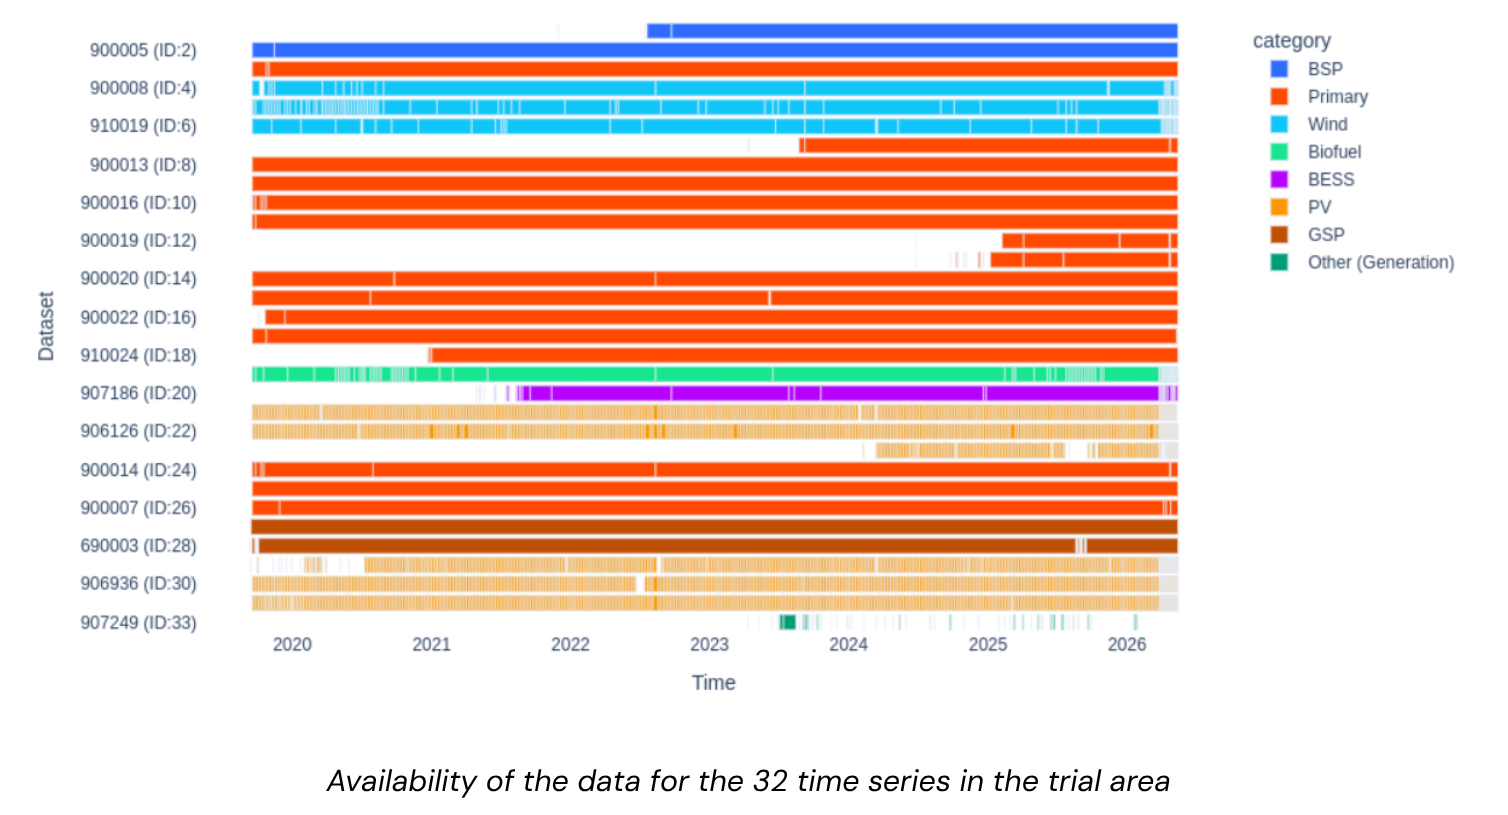
NGED Data Availability
Availability of the data for the 32 time series in the trial area:
Early ramp-up period
The first couple of months after a meter is installed tend to have poor data quality. This is handled by simply dropping the first two months of each time series. 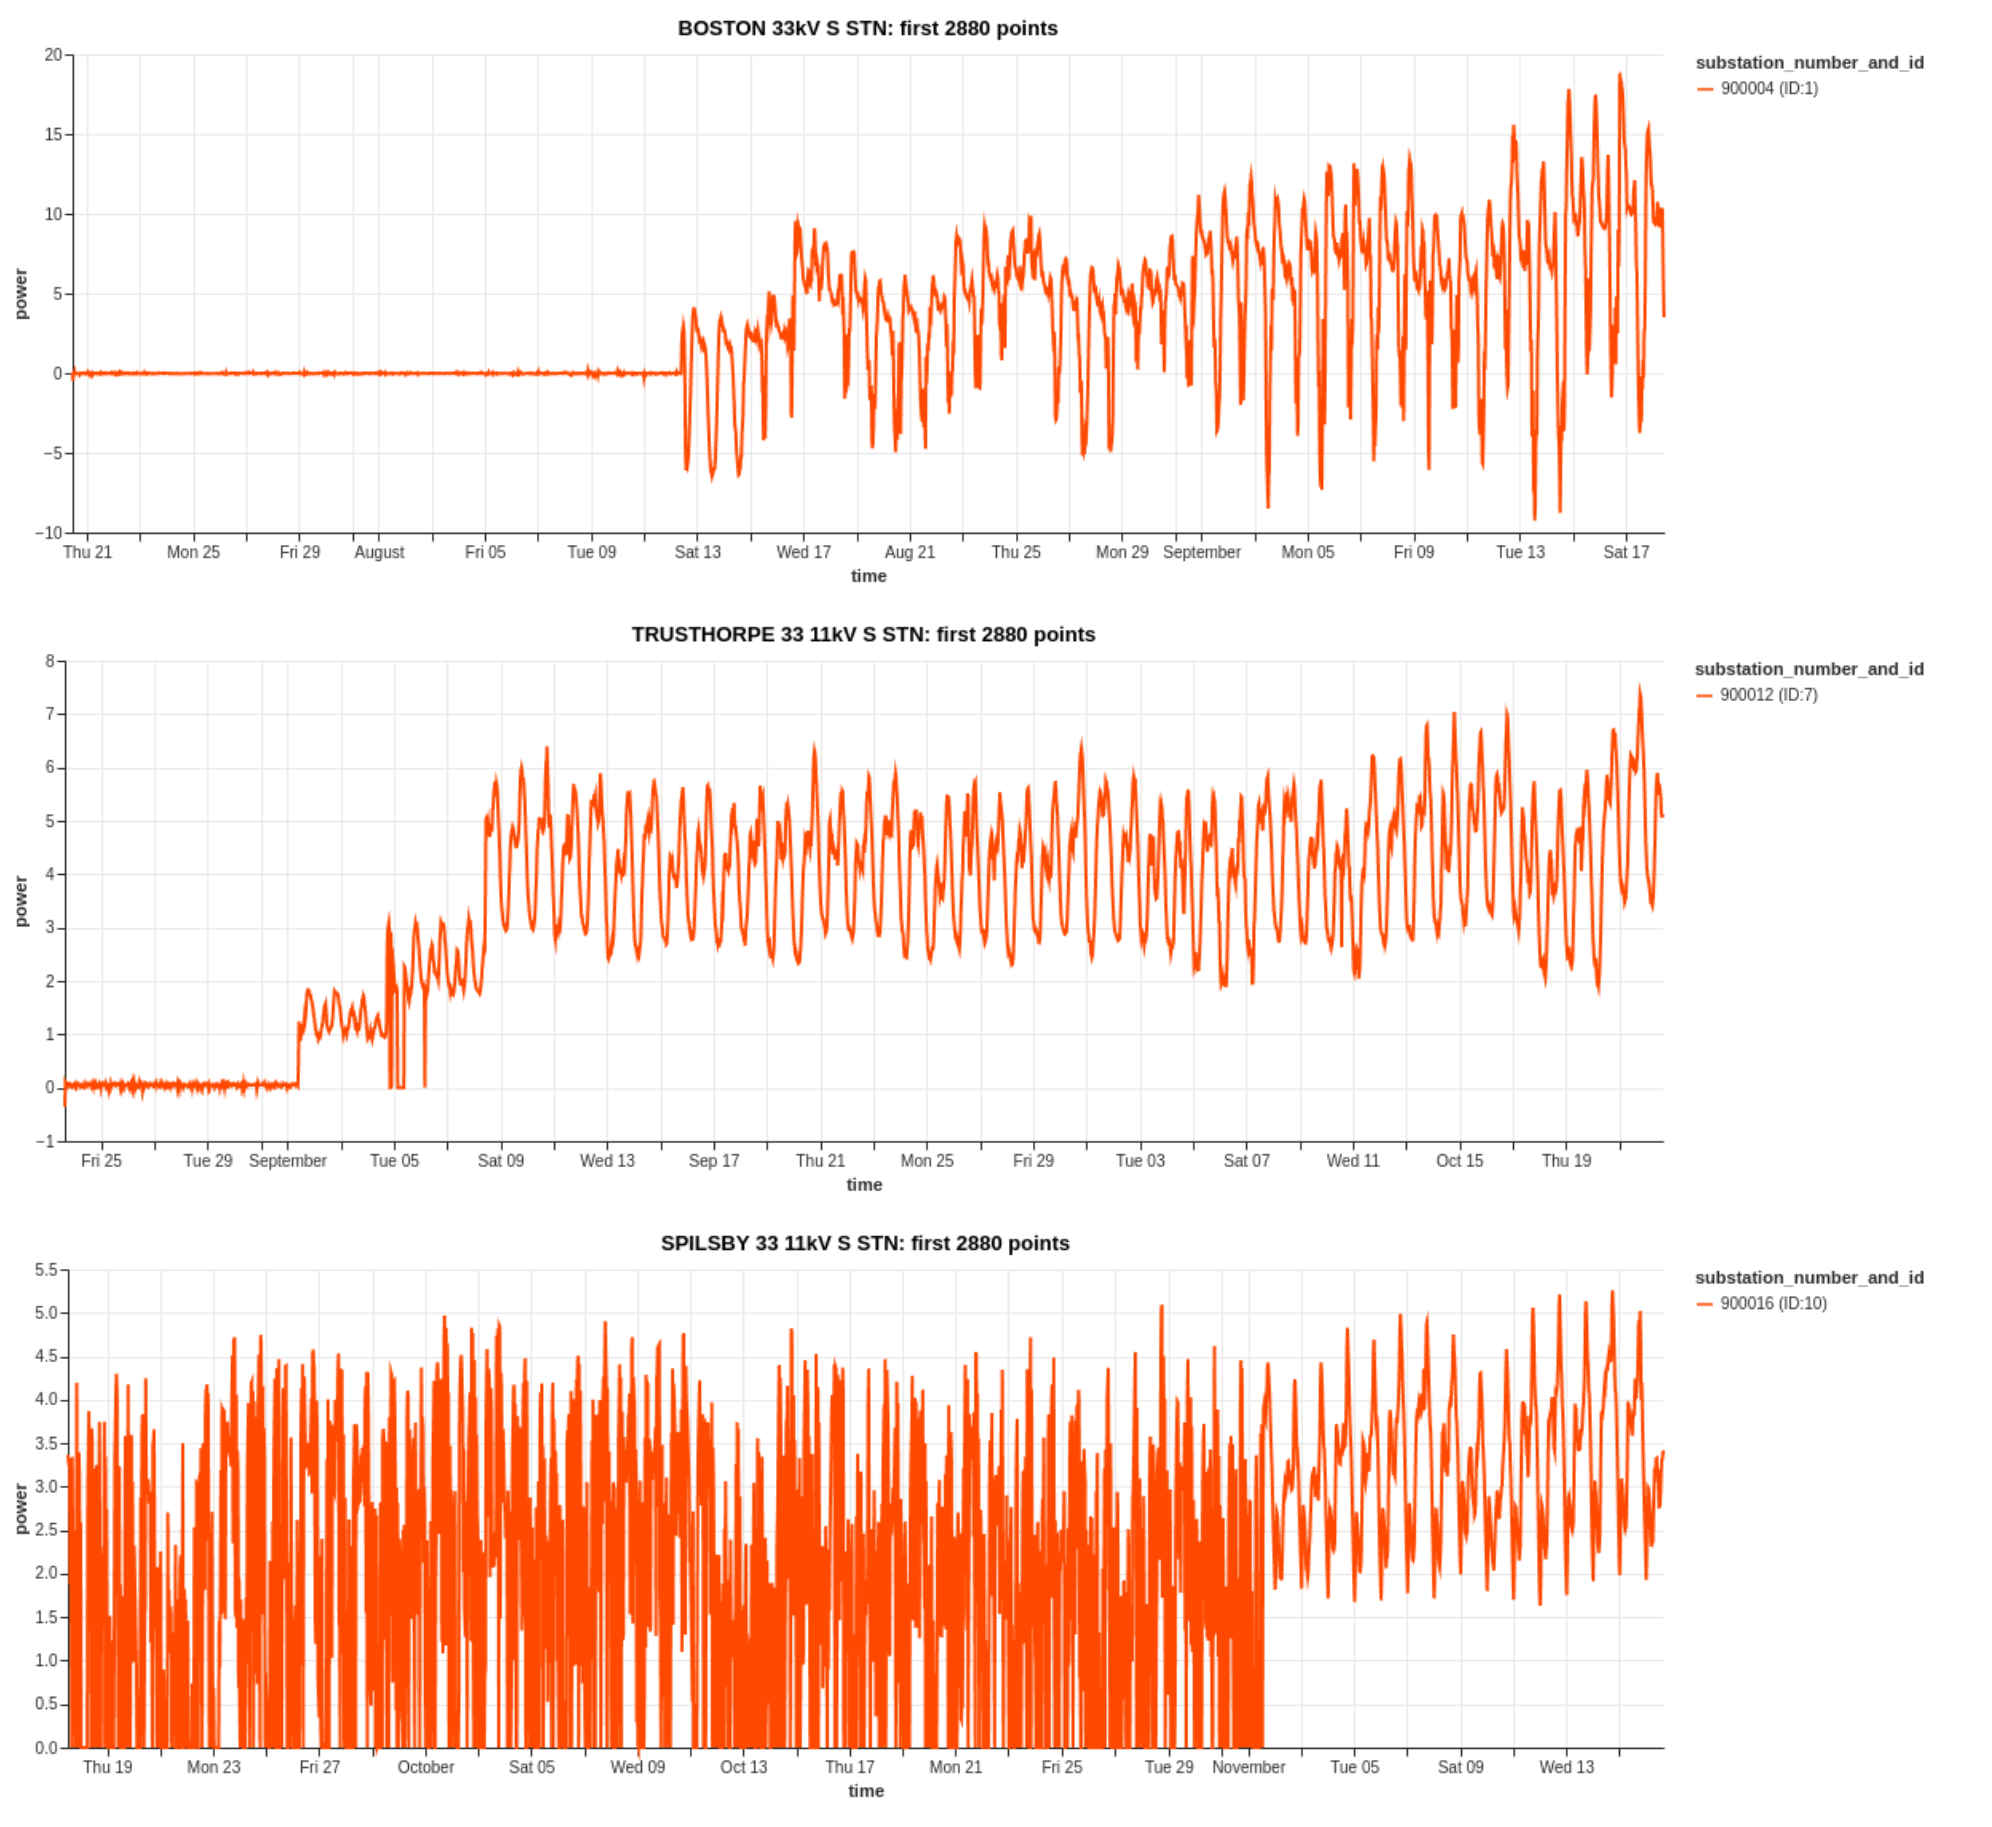
False zeros
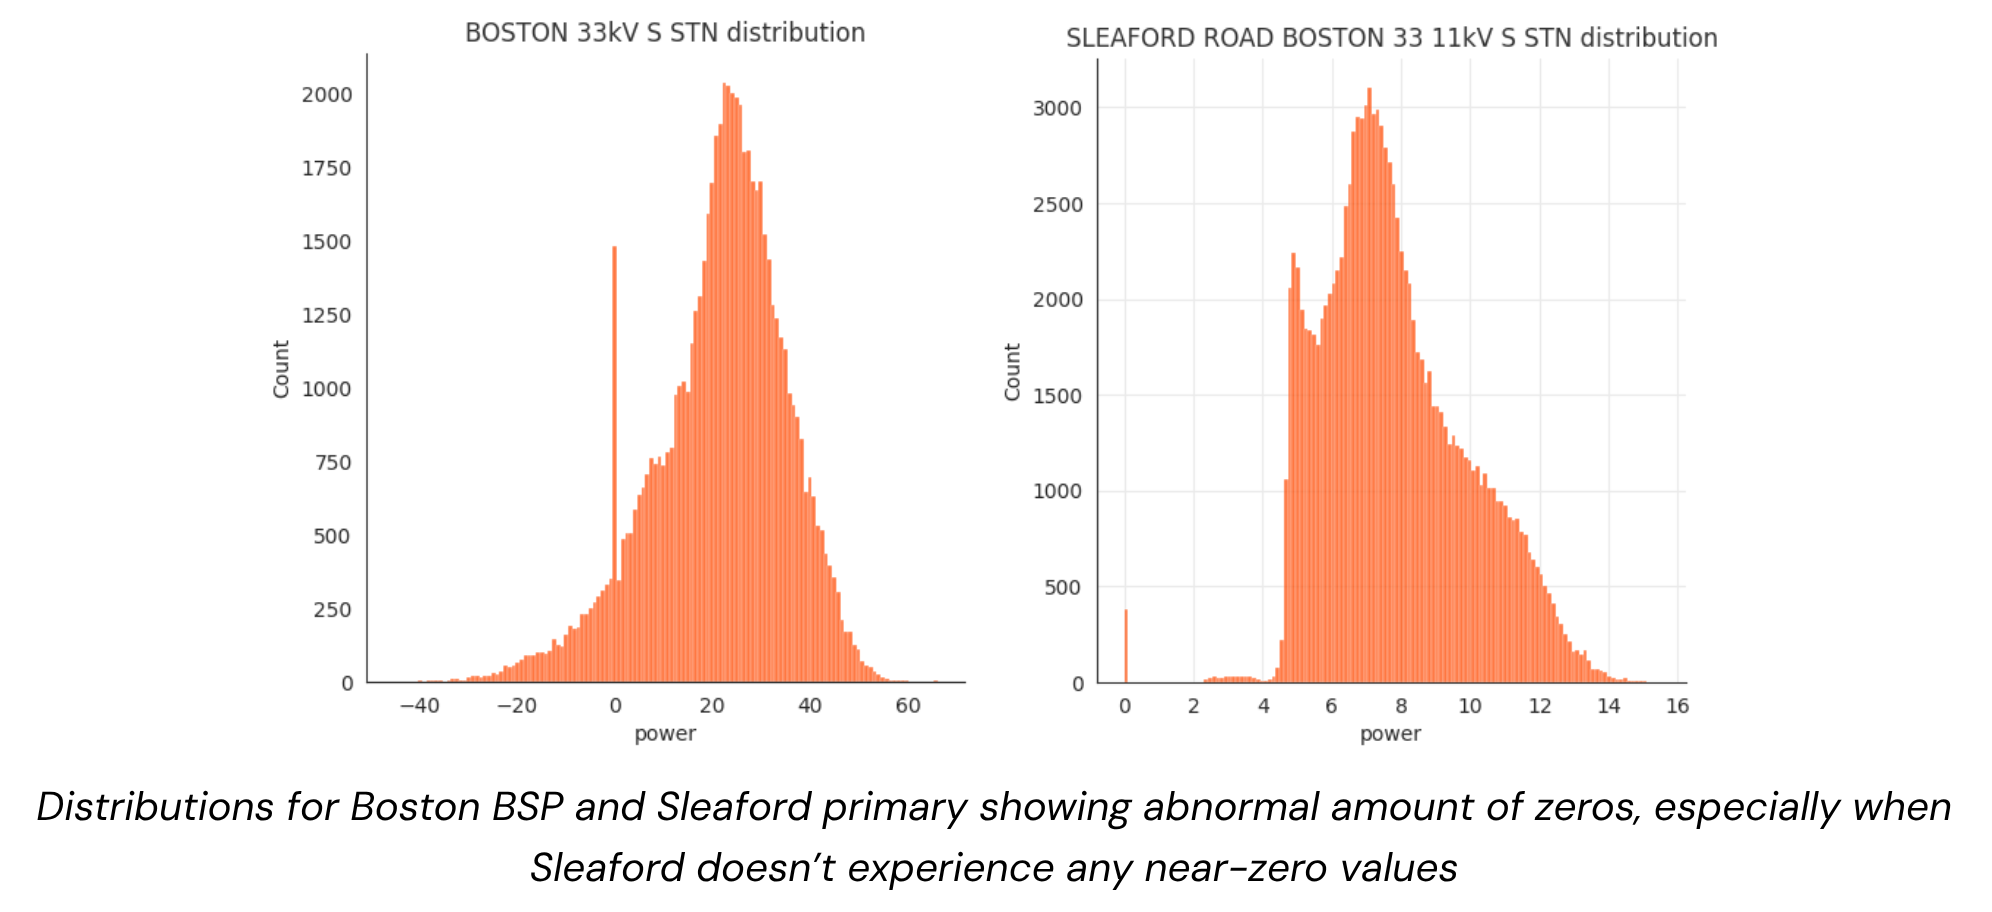
Substation time series occasionally report zero when the true value is non-zero. These are identifiable because they are isolated amongst non-zero values. 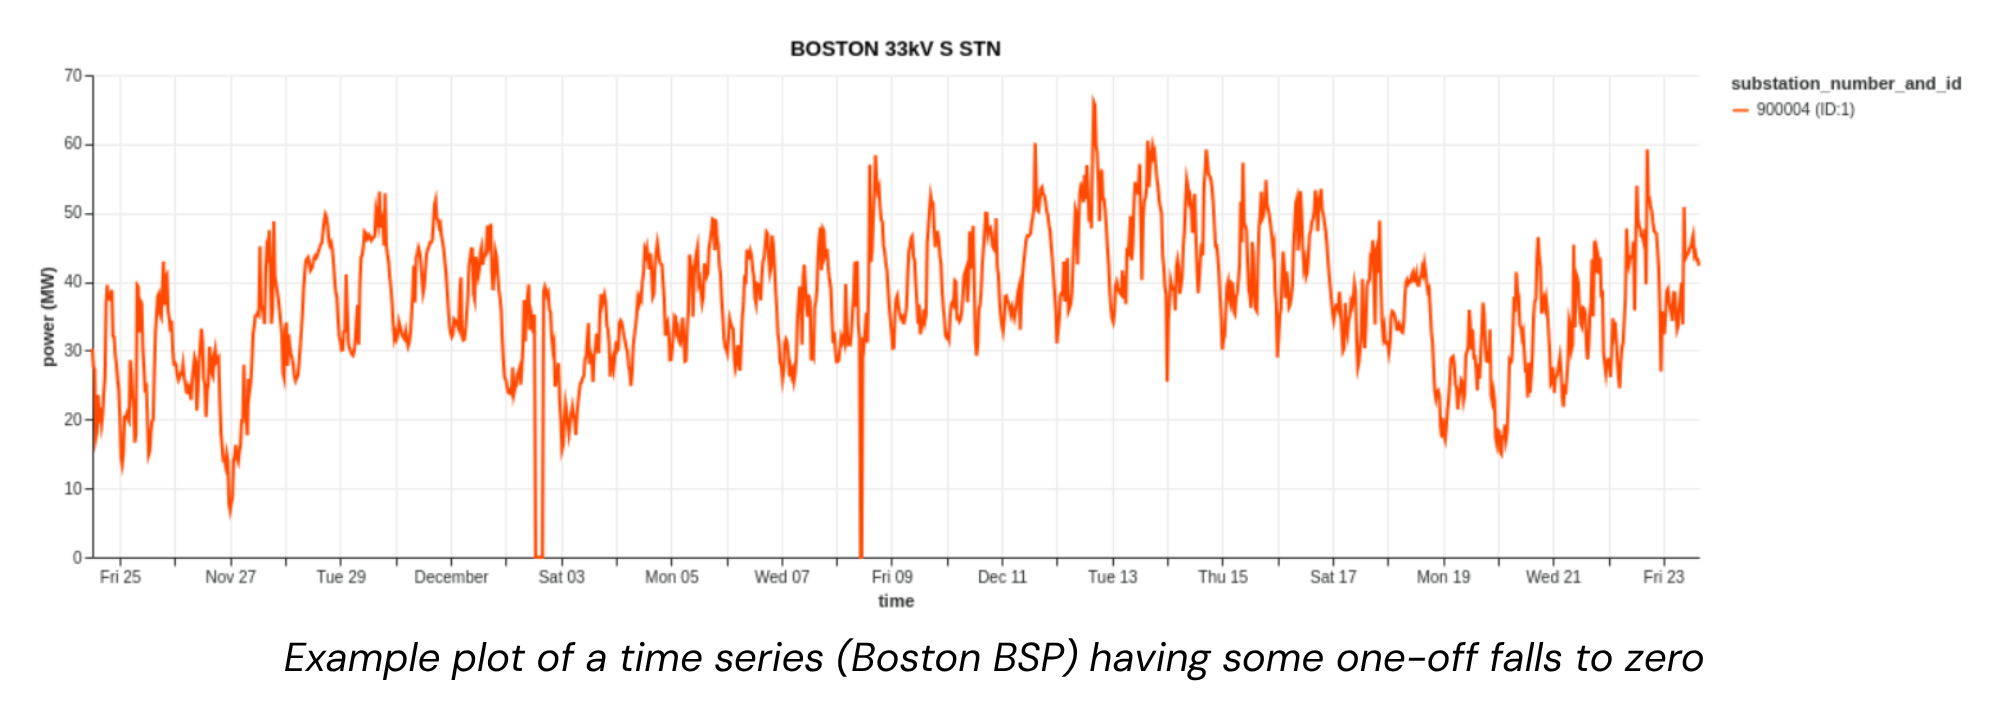 .
. 
Stuck values
Some time series go "stuck" for hours or days (standard deviation near zero over a 24-hour window).
Missing data
Gaps range from a few half-hours to months. Solar farms frequently have no data overnight (expected), but also have unexplained daytime gaps. 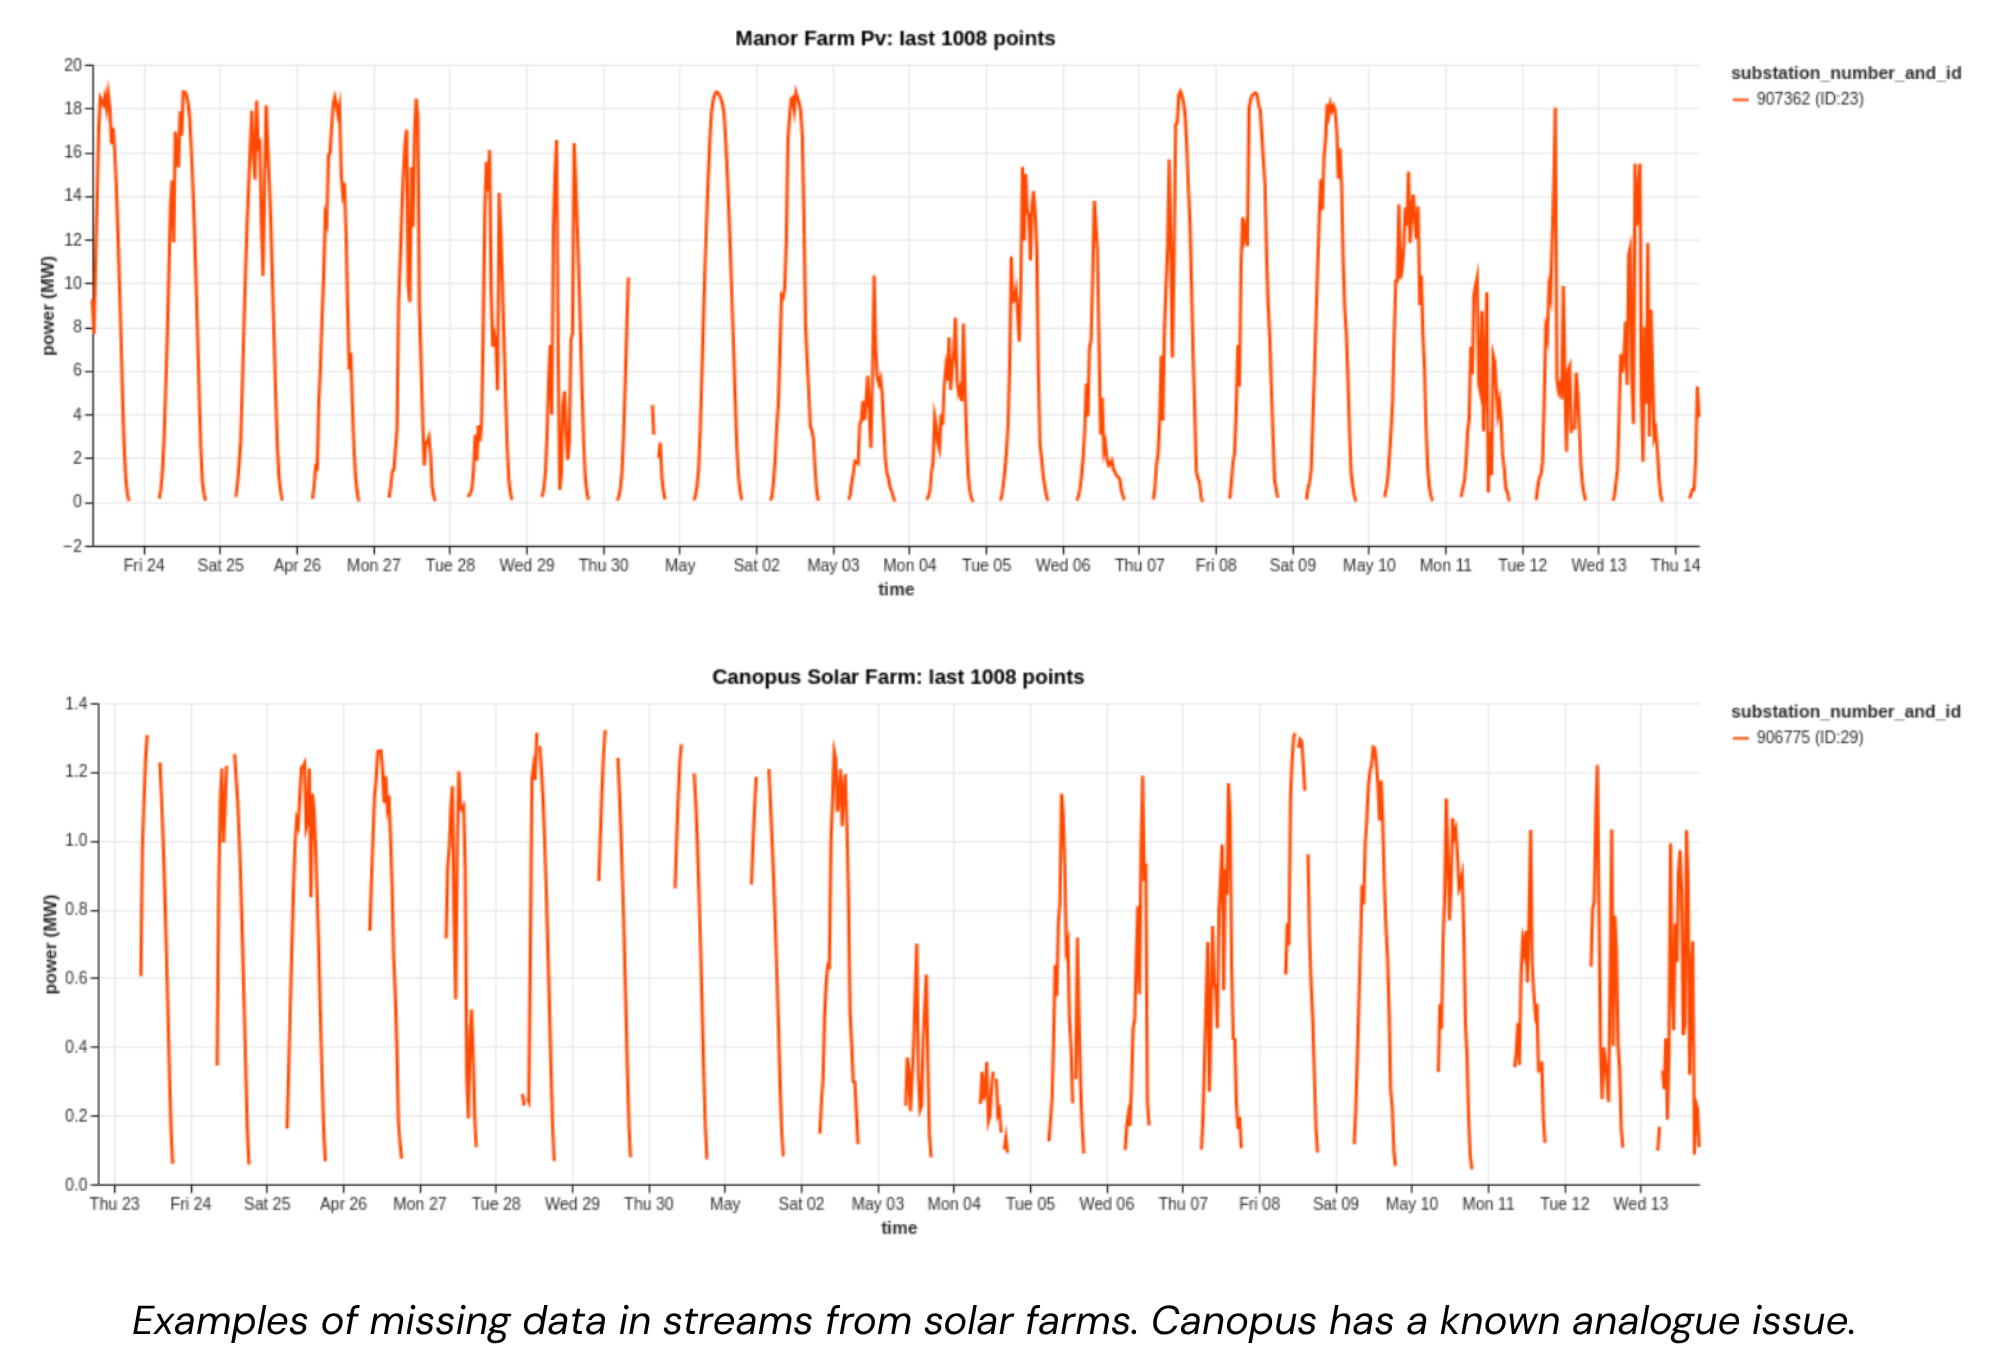
Apparent power (MVA) metering
Some substations only have MVA meters, which report the absolute value of power flow — they cannot detect direction. When generation exceeds demand and power flows "backwards", the MVA reading increases rather than going negative. This "bouncing off zero" behaviour looks like a demand increase but is actually reverse power flow. NGED report that 10 sites in the trial area are non-directional, of which one (and potentially two others) has shown reverse power flow in the past, from studying sunny days. The following figure shows power flow for Stickney primary and Leverton Solar Park; note the absence of peaks at Stickney primary on May 3rd and 4th when Leverton experienced lower generation: 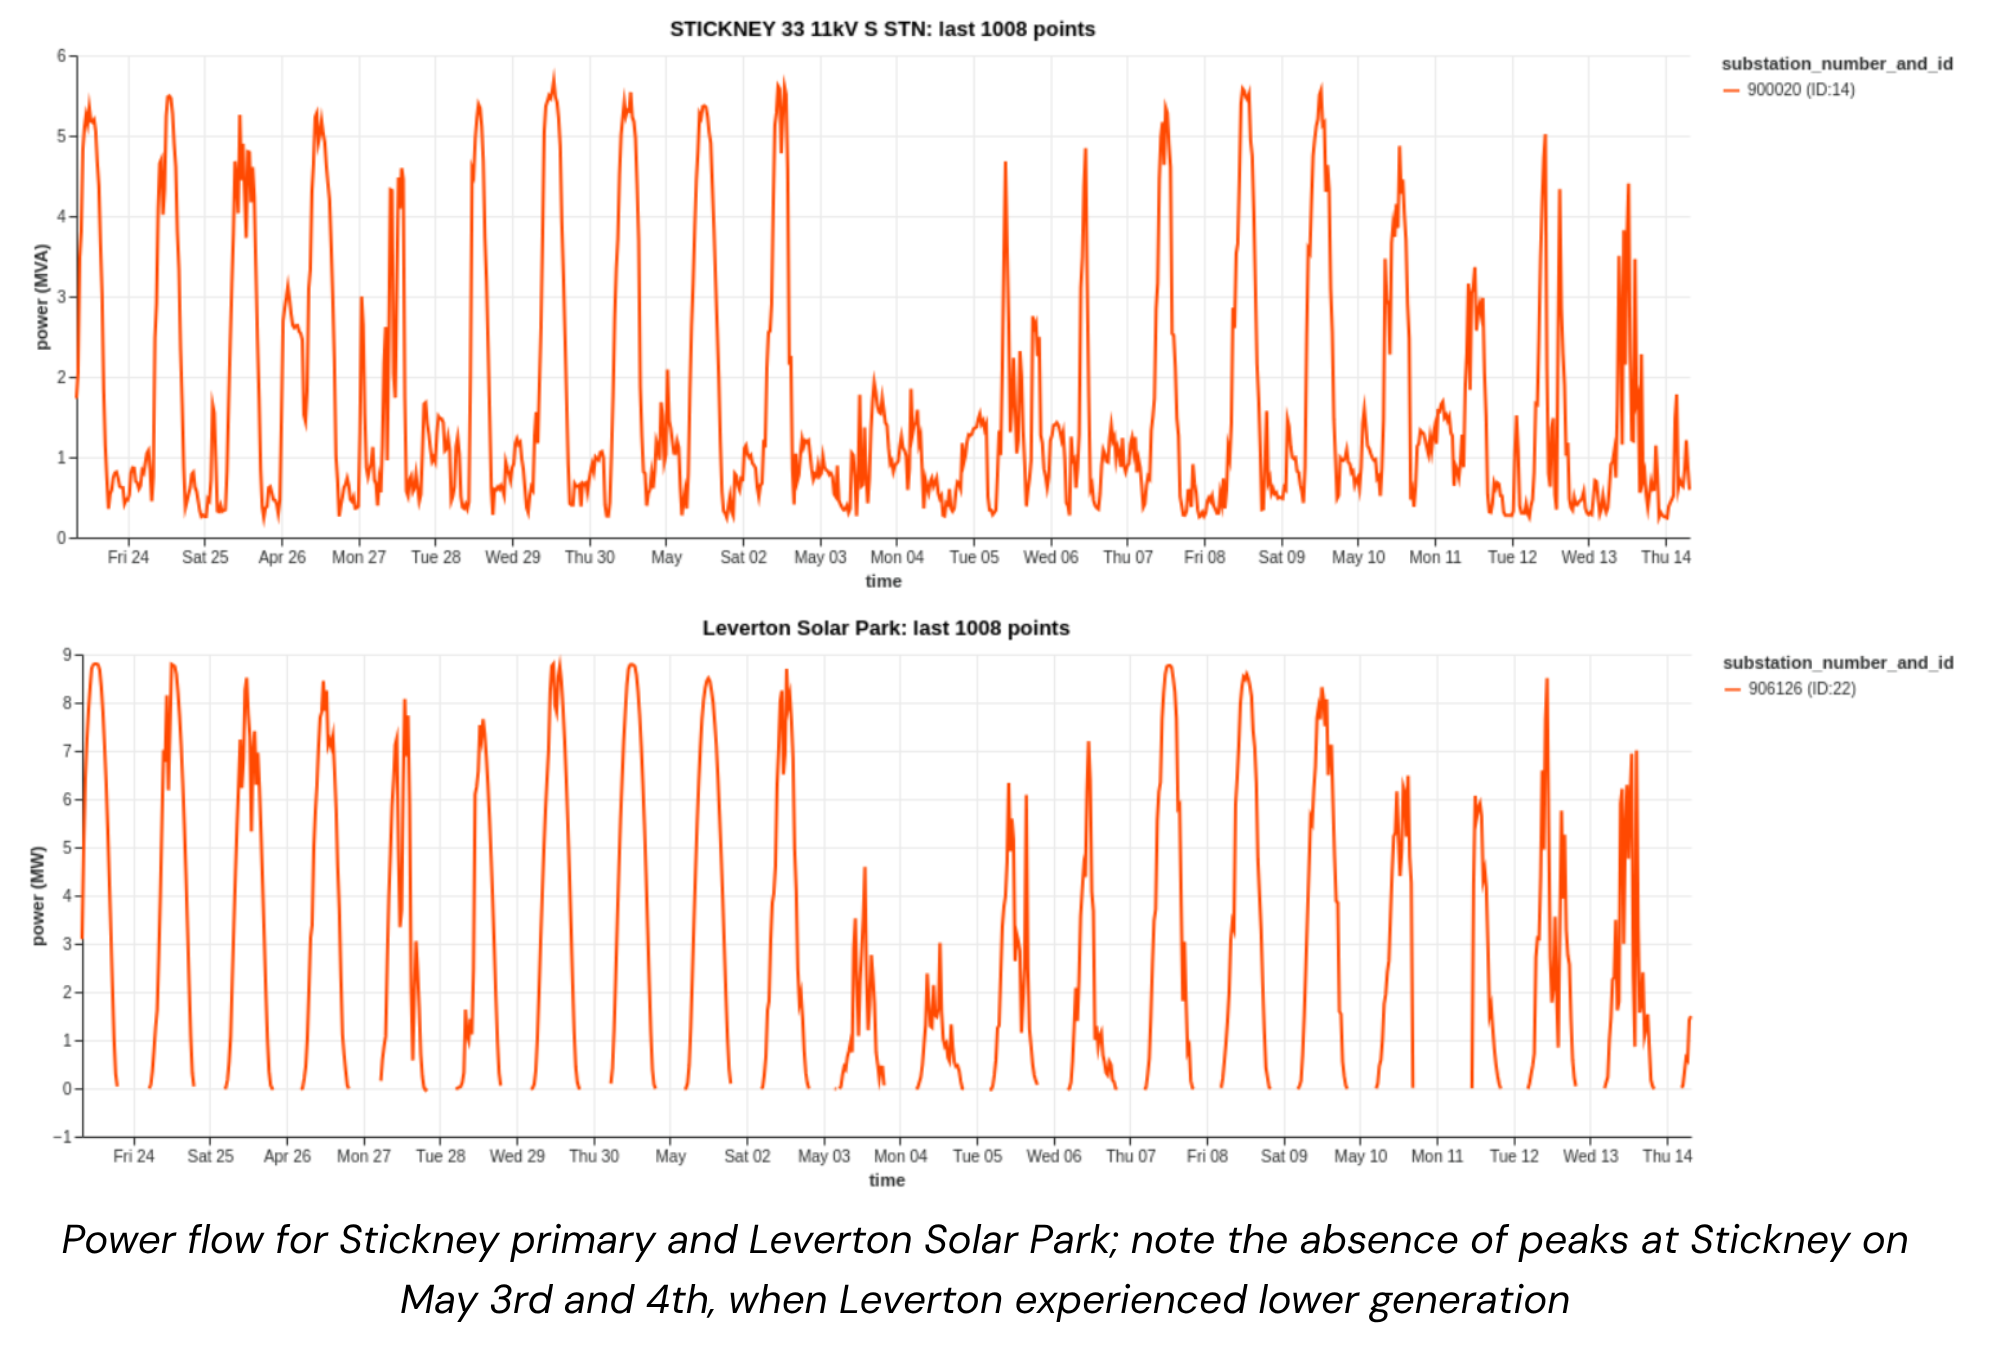
Switching events
Power is periodically diverted from one substation to another during maintenance or in response to faults ("abnormal running arrangement"). Each substation spends roughly 10% of its operating time in an abnormal arrangement. This severely biases lagged-power features (the single most informative feature for demand forecasting) if not detected and handled. Recovering the demand that would have been metered under the normal running arrangement is described in Switching Events; the staged solution plan is in the roadmap (v0.6 detector → v2 mixture models).
See the "Data sources" section of our Milestone 1 report for a more detailed discussion, and plenty of graphs!